Net Worth by Age: 2026 Benchmarks (Median vs Average)

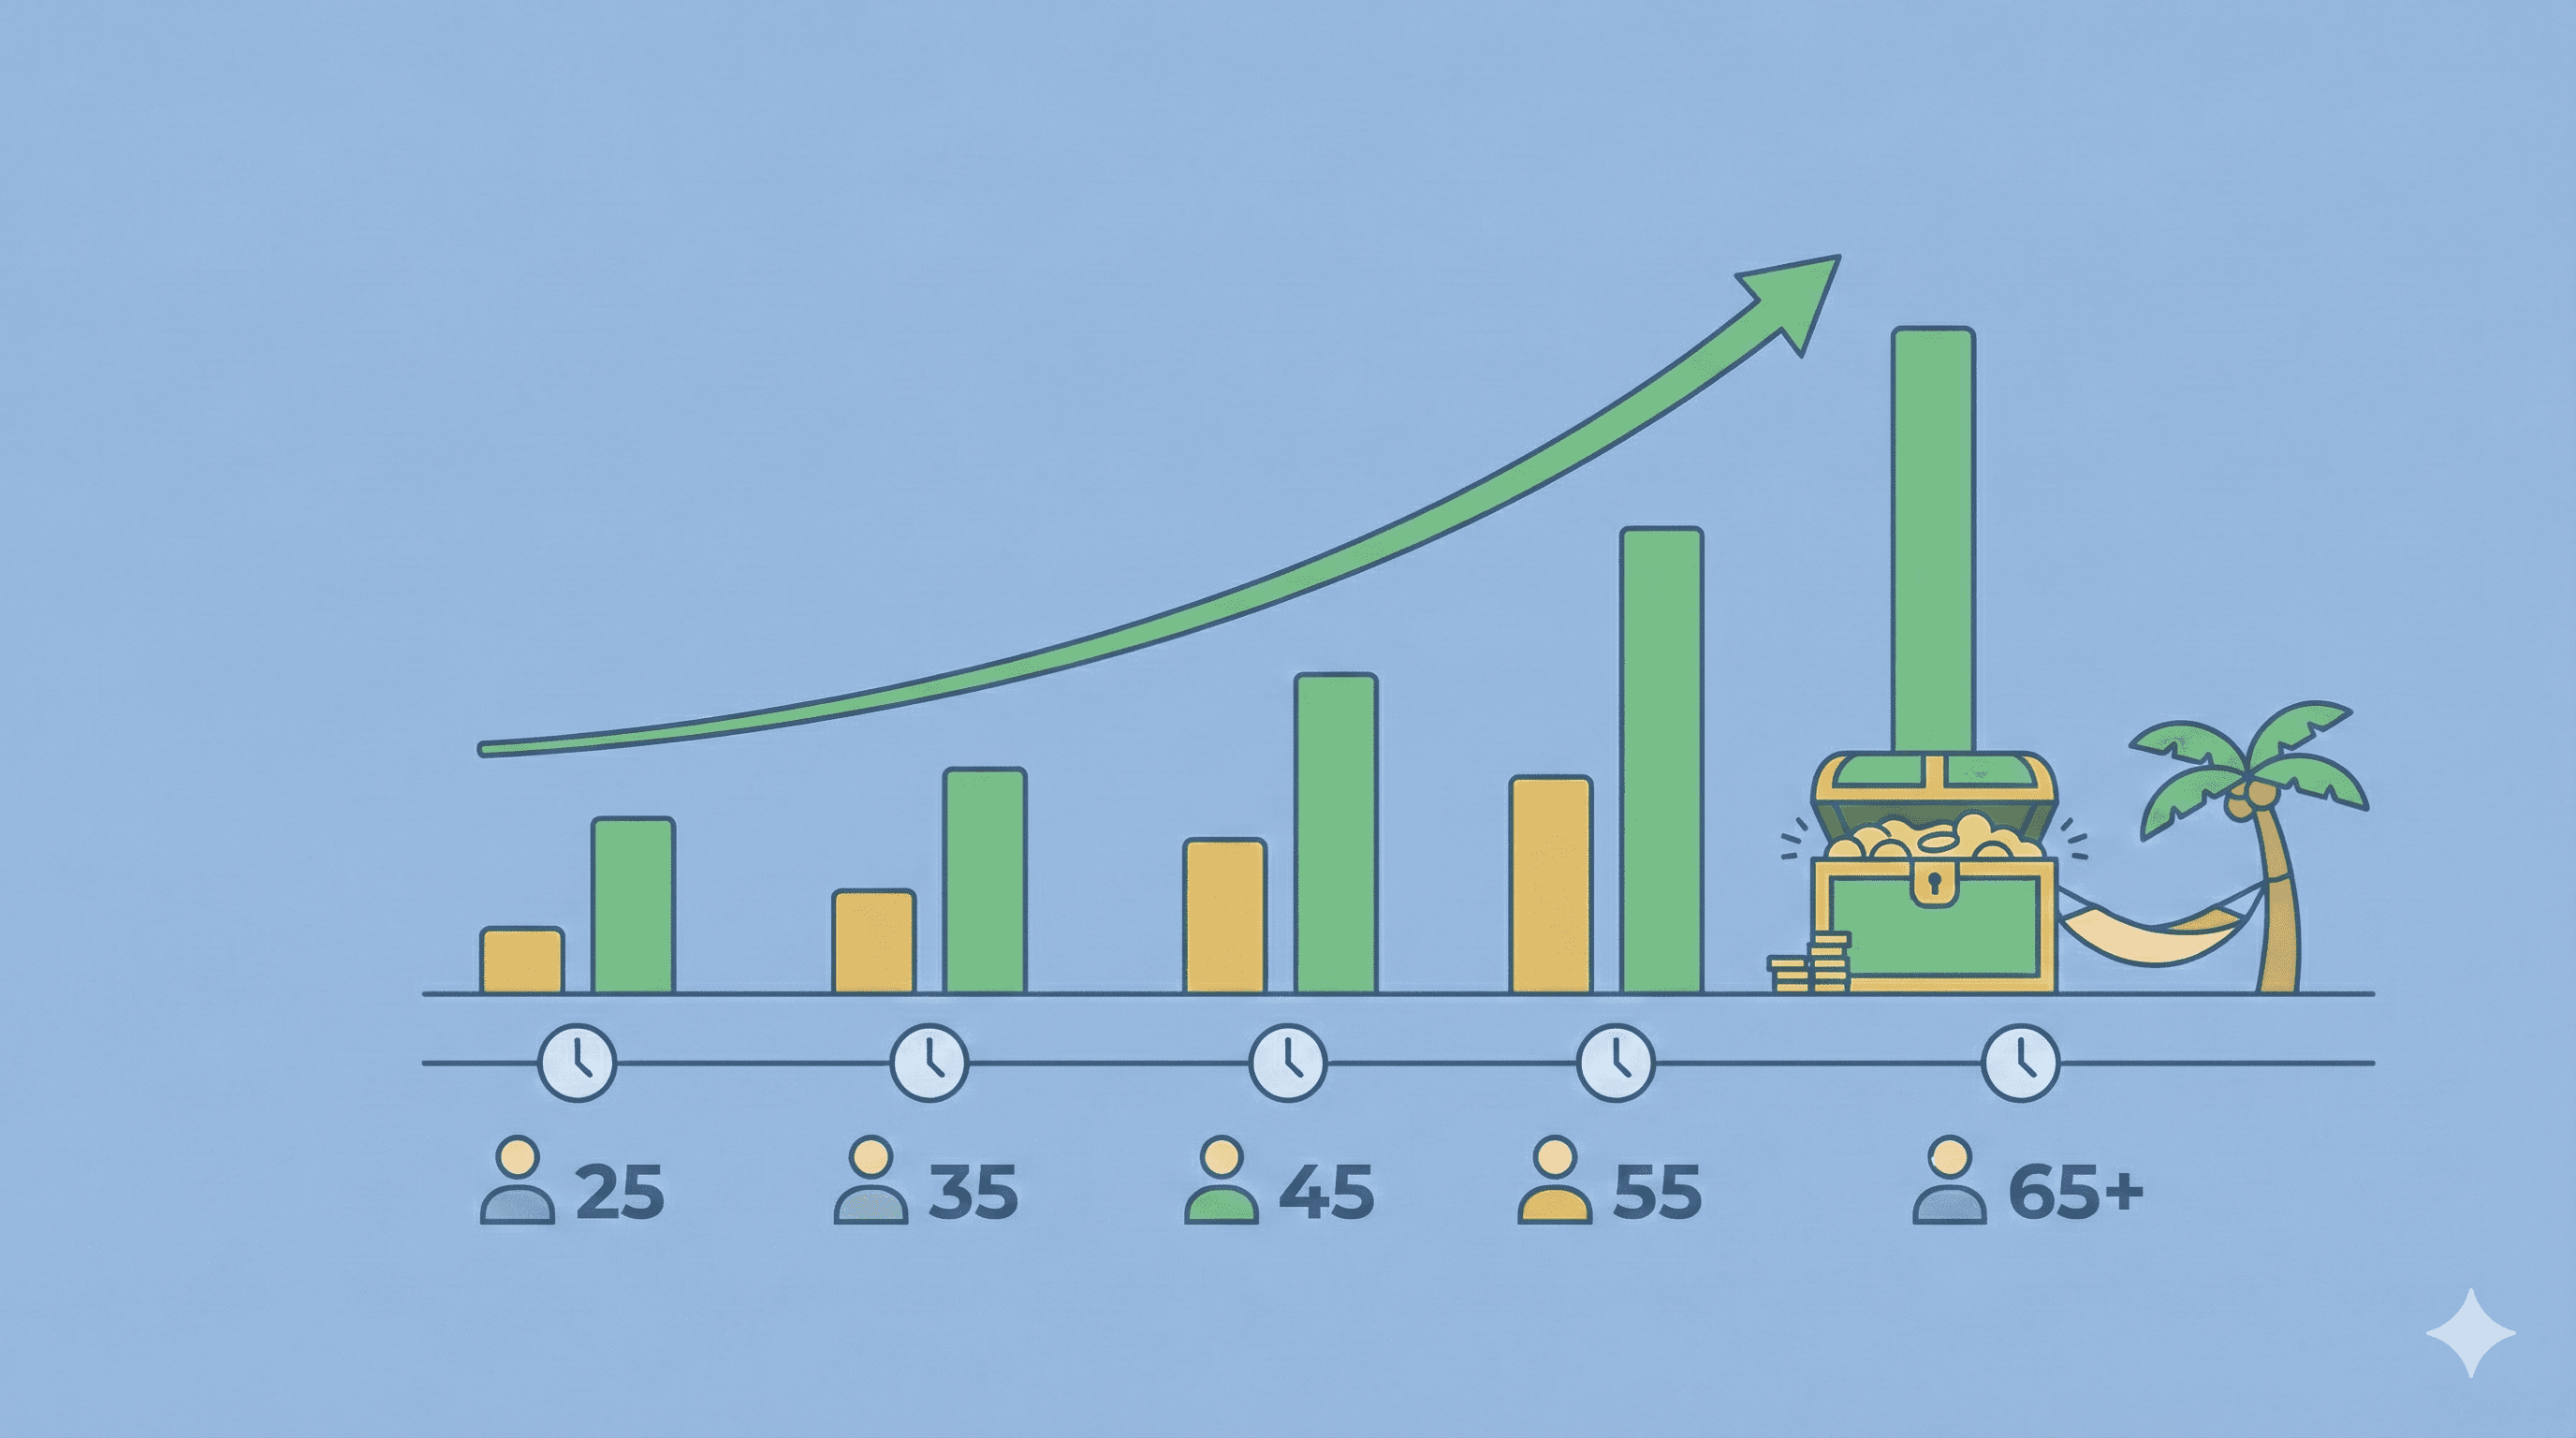
Ever wondered if you're "normal" financially?
If you have enough saved for your age? If others your age are investing, or also living paycheck to paycheck?
Today, we're diving in. Numbers, data, reality.
But first, a quick note that will change how you read everything below:
Throughout this article, focus on the "median" numbers, not the "average." Why? The average gets pulled up by billionaires and doesn't reflect reality for most of us. The median is the middle person — half of people have more, half have less. That's the number that actually matters.
And if you want the personalized version of this entire article, the net worth percentile checker takes your number and your age and tells you exactly where you stand — built on the same Federal Reserve SCF data used below.
Average vs. Median — The $800,000 Difference
Here's why this distinction is so important:
When someone says "the average American has a net worth of $1 million," it doesn't mean most people have a million bucks. A handful of billionaires pull that number way up.
Median is a better indicator — it's the actual middle point.
| Metric | Value |
|---|---|
| Average net worth | $1,063,700 |
| Median net worth | $192,900 |
That difference — over $800,000 — tells you everything about how wealth is distributed in America...
Before any of these benchmarks mean anything, though, you need your own figure to hold up against them: how to calculate net worth is assets minus liabilities, with a worked example you can copy line for line.
A note on data vintage: the net worth figures in this article come from the Federal Reserve's Survey of Consumer Finances, which is run every three years. The most recent published edition was collected in 2022 (released October 2023) — it is still the best household-wealth data that exists for the US, but treat the dollar figures as a slightly dated baseline. The 2025 survey's results are expected in late 2026.
How Much Do Americans Actually Earn?
Before we look at wealth, let's talk income. Because a lot stems from that.
| Metric (2024) | Value |
|---|---|
| Average household income | ~$121,000 |
| Median household income | $83,730 |
Again — average vs. median. Most Americans don't reach the average income.
When you read news about how great the average is, remember this article and have a laugh at how statistics can mislead.
Income by Age
Peak earners are in their late 40s to early 50s. Surprised or not?
| Age Group | Median Income | Year-over-Year Change |
|---|---|---|
| Under 25 | $60,310 | +7.0% |
| 25–34 | $90,100 | +2.4% |
| 35–44 | $106,100 | +2.1% |
| 45–54 | $116,800 | +2.8% |
| 55–64 | $91,620 | -1.5% |
| 65+ | $54,710 | +4.6% |
Peak earning years are around 45–54. After that, income starts declining as people transition toward retirement.
Where Does the Money Flow?
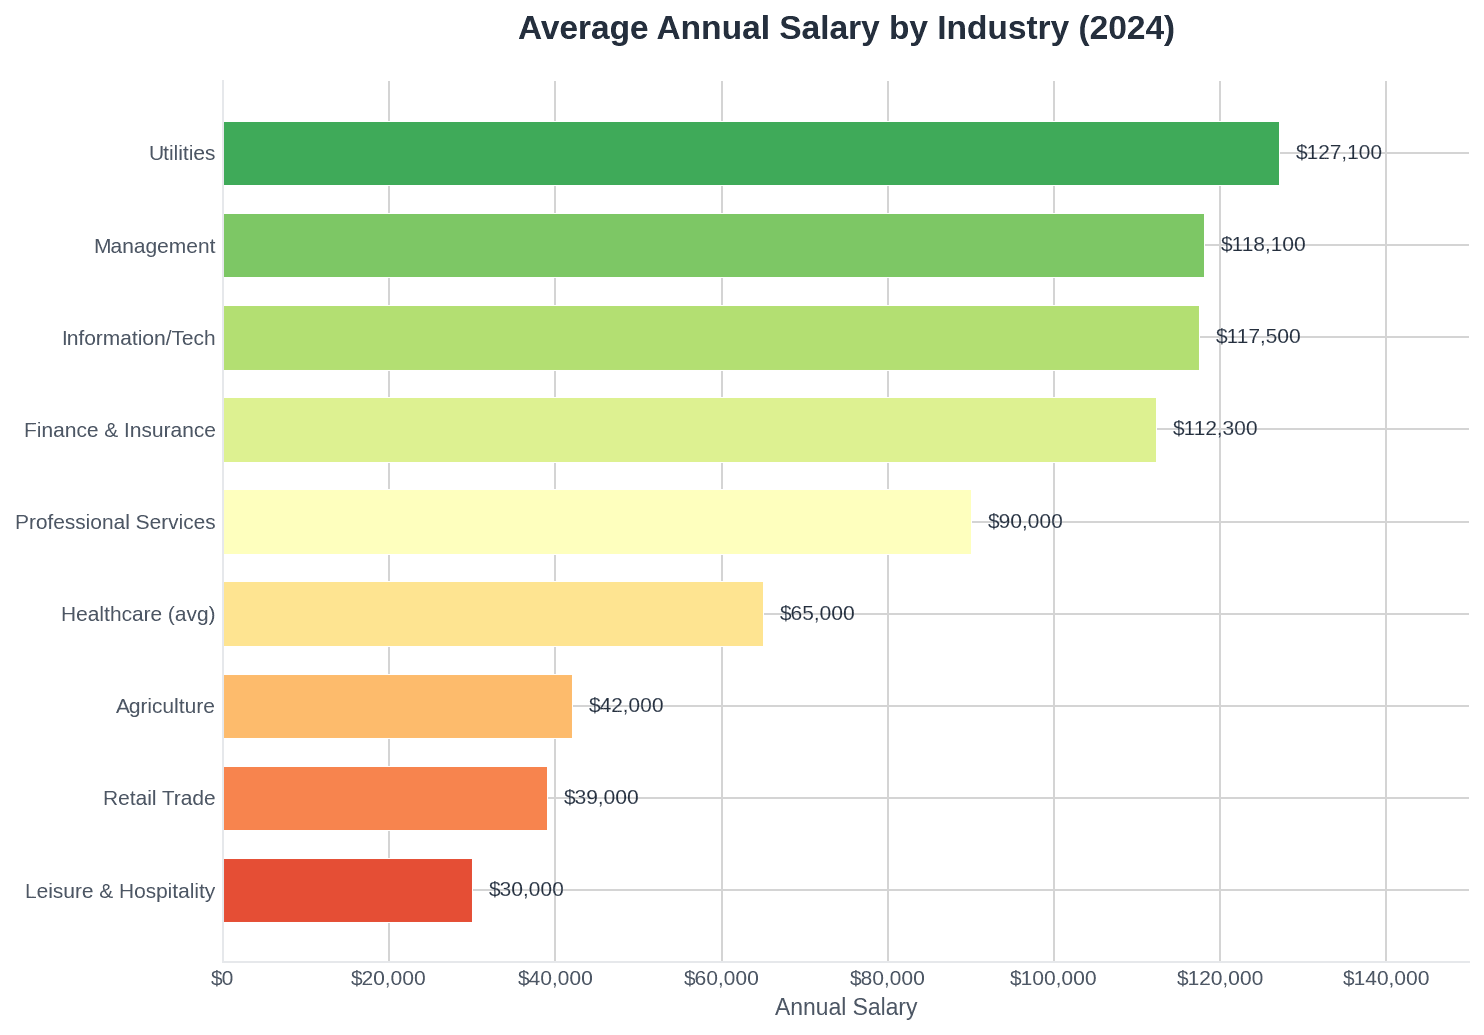
Tech and finance lead with massive margins. Hospitality is on the opposite end.
| Industry | Average Annual Salary |
|---|---|
| Utilities | $127,100 |
| Information/Tech | $114,500–$120,370 |
| Finance & Insurance | $112,300 |
| Management | $118,100 |
| Professional Services | $88,000–$92,000 |
| Healthcare (varies widely) | $54,870–$220,850 |
| Retail | $39,000 |
| Leisure & Hospitality | $30,000 |
The difference between tech ($120K) and hospitality ($30K) is 4x.
There are surprises too — utilities have quietly climbed to the top over recent years!
If you or your kid is currently figuring out their future, I recommend adding this table to your decision tree.
Where Americans Hold Their Wealth
This number honestly surprised me.
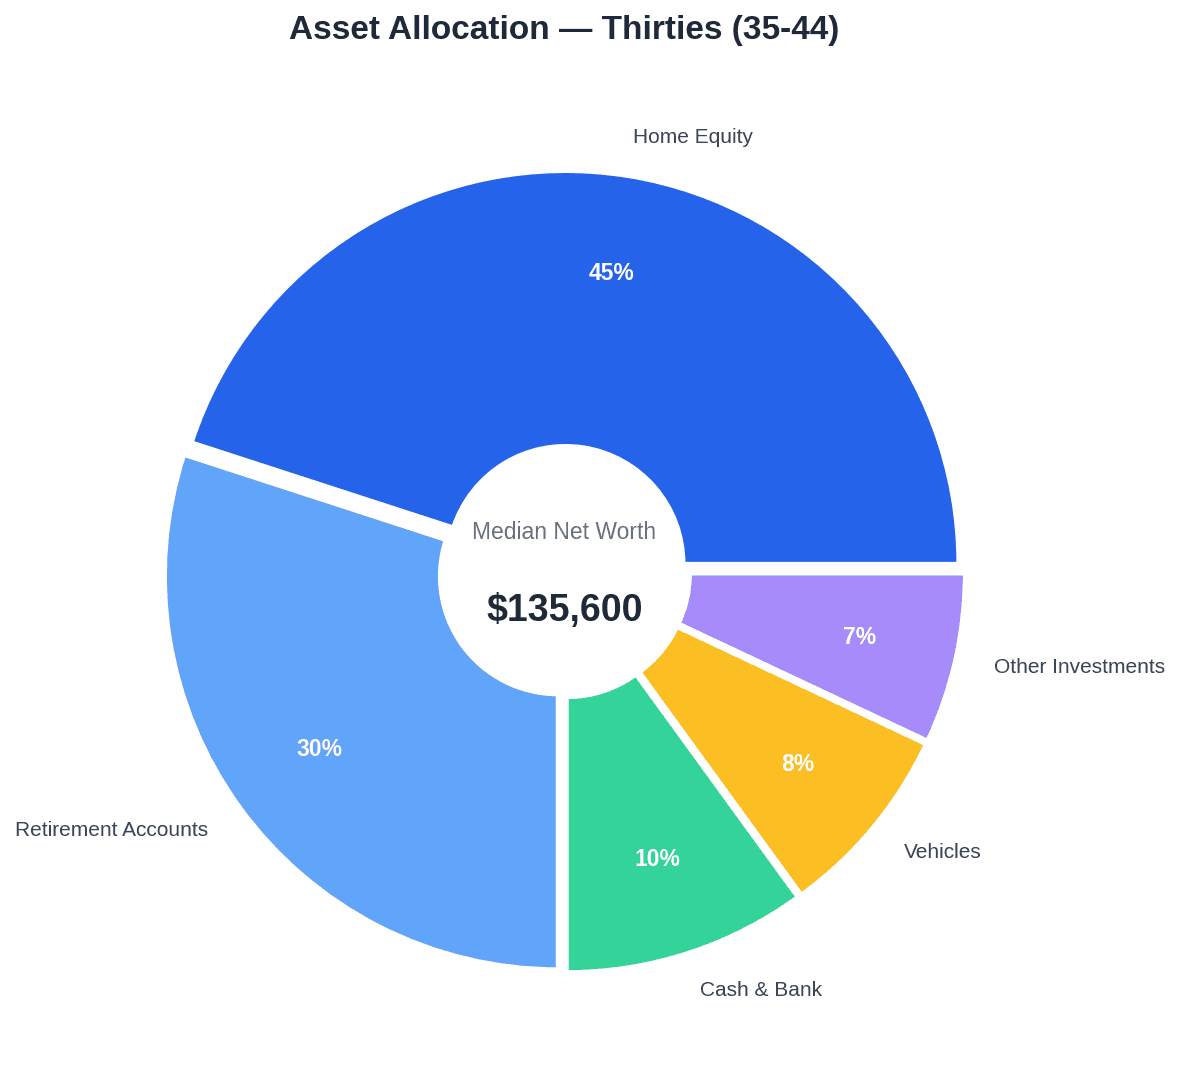
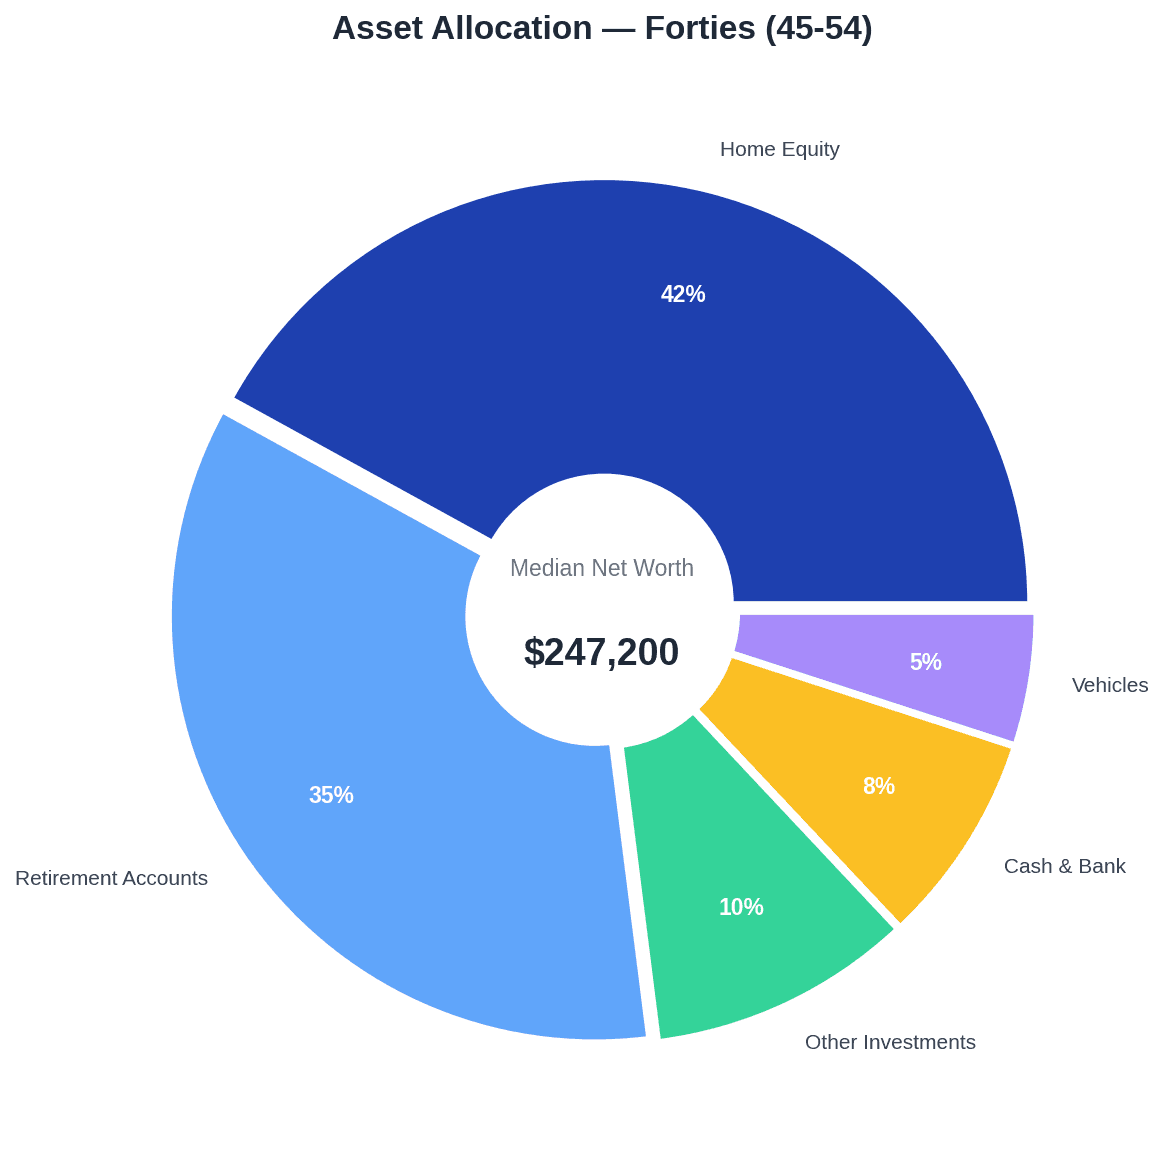
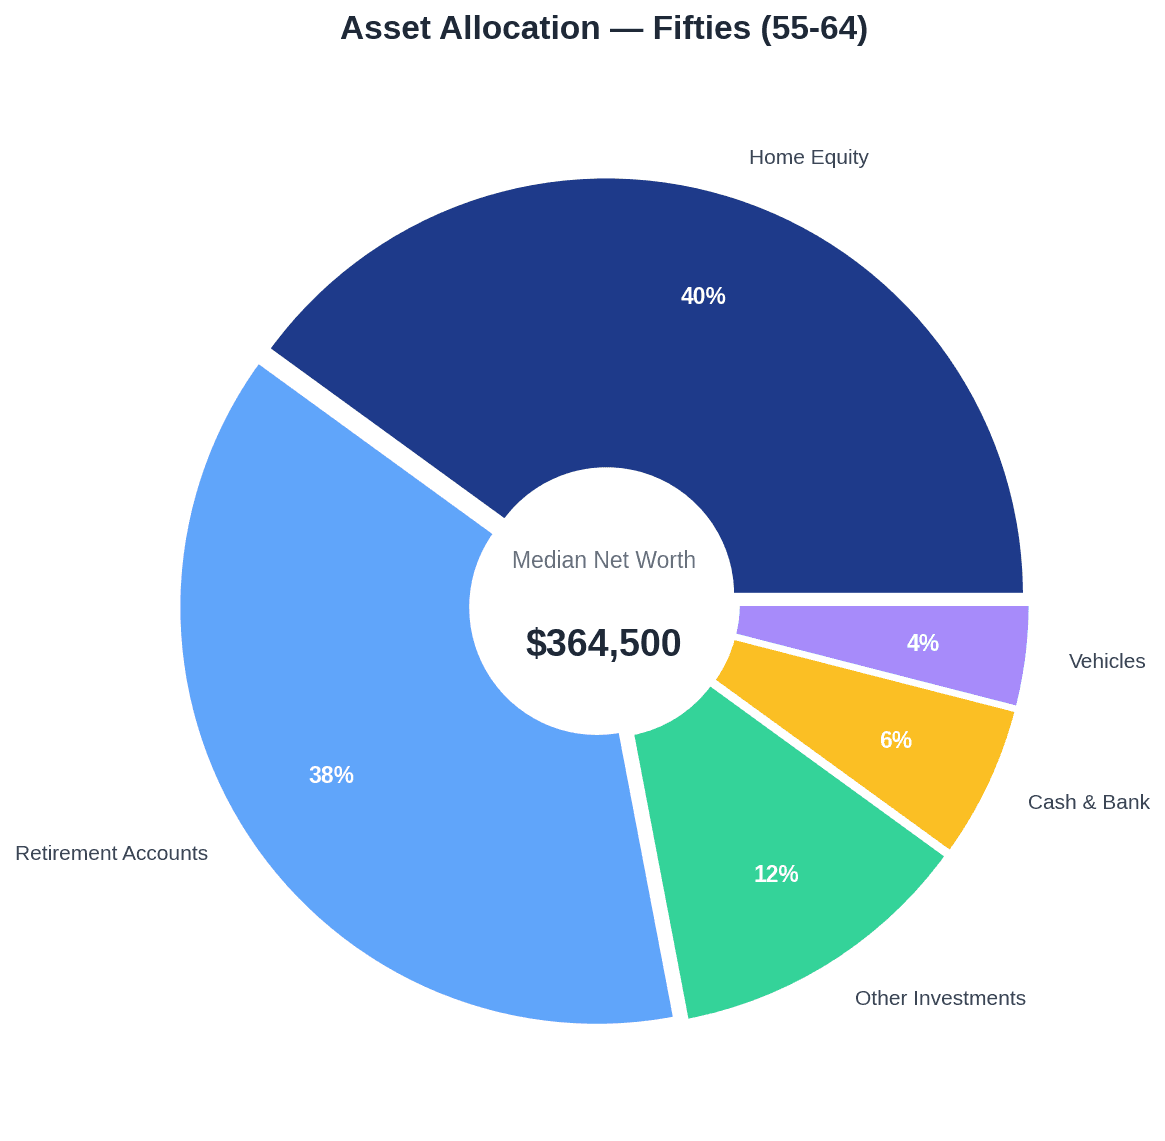
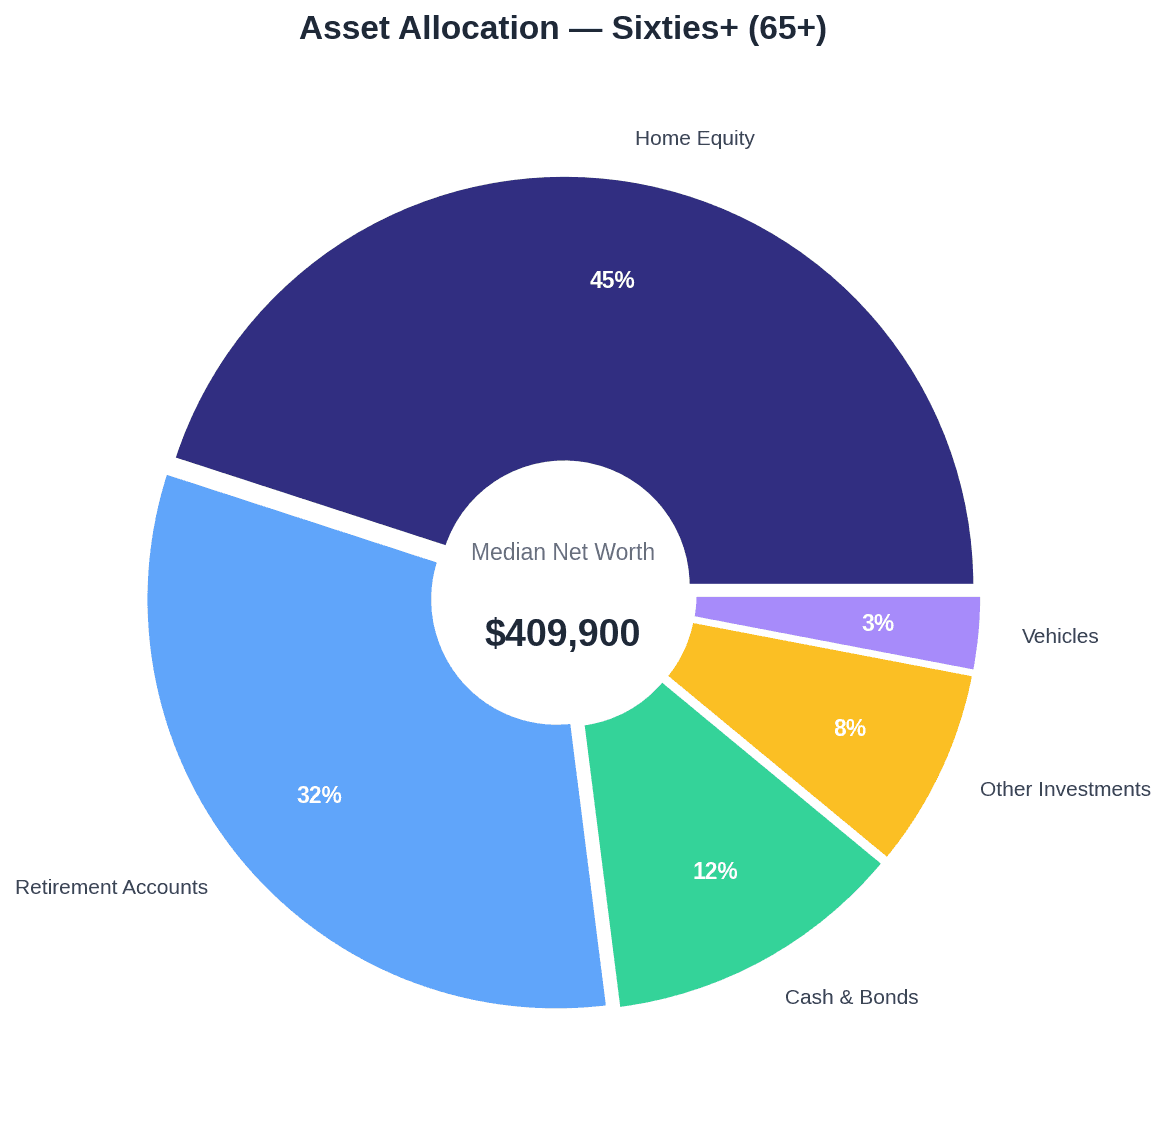
For the median household, about 45% of net worth is in their primary home.
Add retirement accounts (~27%), and you've covered most of what typical Americans own.
We're a nation of homeowners and 401(k) holders. Which has its advantages and disadvantages.
Advantage? You have somewhere to live and forced retirement savings.
Disadvantage? Your wealth is extremely illiquid. When you need cash fast, you can't sell your house in a week. And your retirement funds are locked up.
The wealthy play a different game entirely — the top 1% hold only 13% in real estate versus 41% in business equity and 31% in stocks. The top 10% own approximately 92% of all equities.
The Gap Between Homeowners and Renters
Here's the brutal reality.
| Housing Type | Median Net Worth |
|---|---|
| Homeowner | $400,000 |
| Renter | $10,400 |
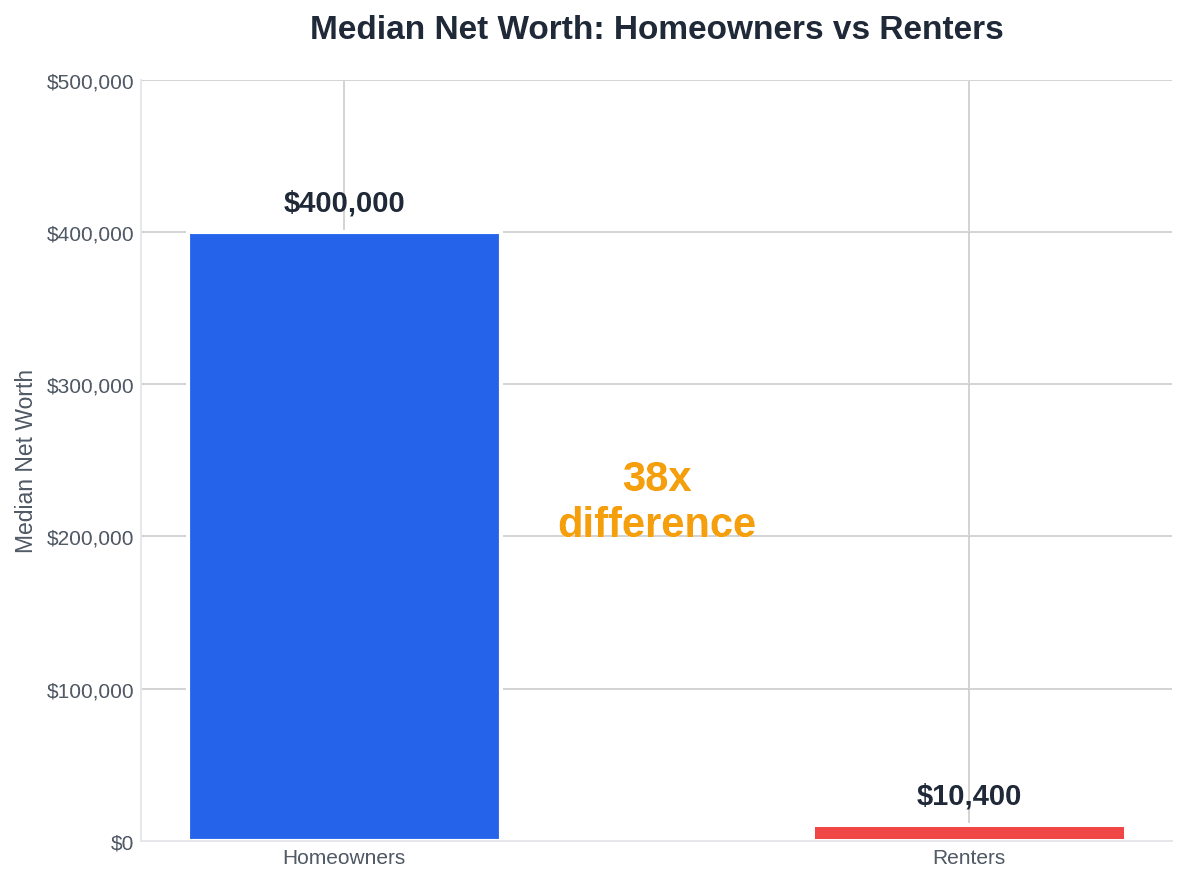
The difference between owner and renter? 38:1.
It's not just that homeowners are "smarter." Often they inherited, bought in a better era, or were lucky enough to have parents who helped with the down payment.
But it's the reality we have to work with.
Homeownership rates tell their own story:
| Age Group | Homeownership Rate |
|---|---|
| Under 35 | 36.3% |
| 35–44 | 61.4% |
| 45–54 | 71.0% |
| 55–64 | 76.3% |
| 65+ | 79.5% |
Under-35 homeownership fell to its lowest level since 2019 last year. The average age of first-time homebuyers hit a record 38 years in 2024.
Mathematically, renting and investing the difference can sometimes work out better, but we can't discount the magic factor of "forced savings" that a mortgage provides.
I have a whole article on this topic if you're interested in diving deeper.
What Finances Look Like by Age
Now for the main event — where are your peers, and where are they heading?
Twentysomethings (Under 25 & 25–34)
This generation surprised me the most.
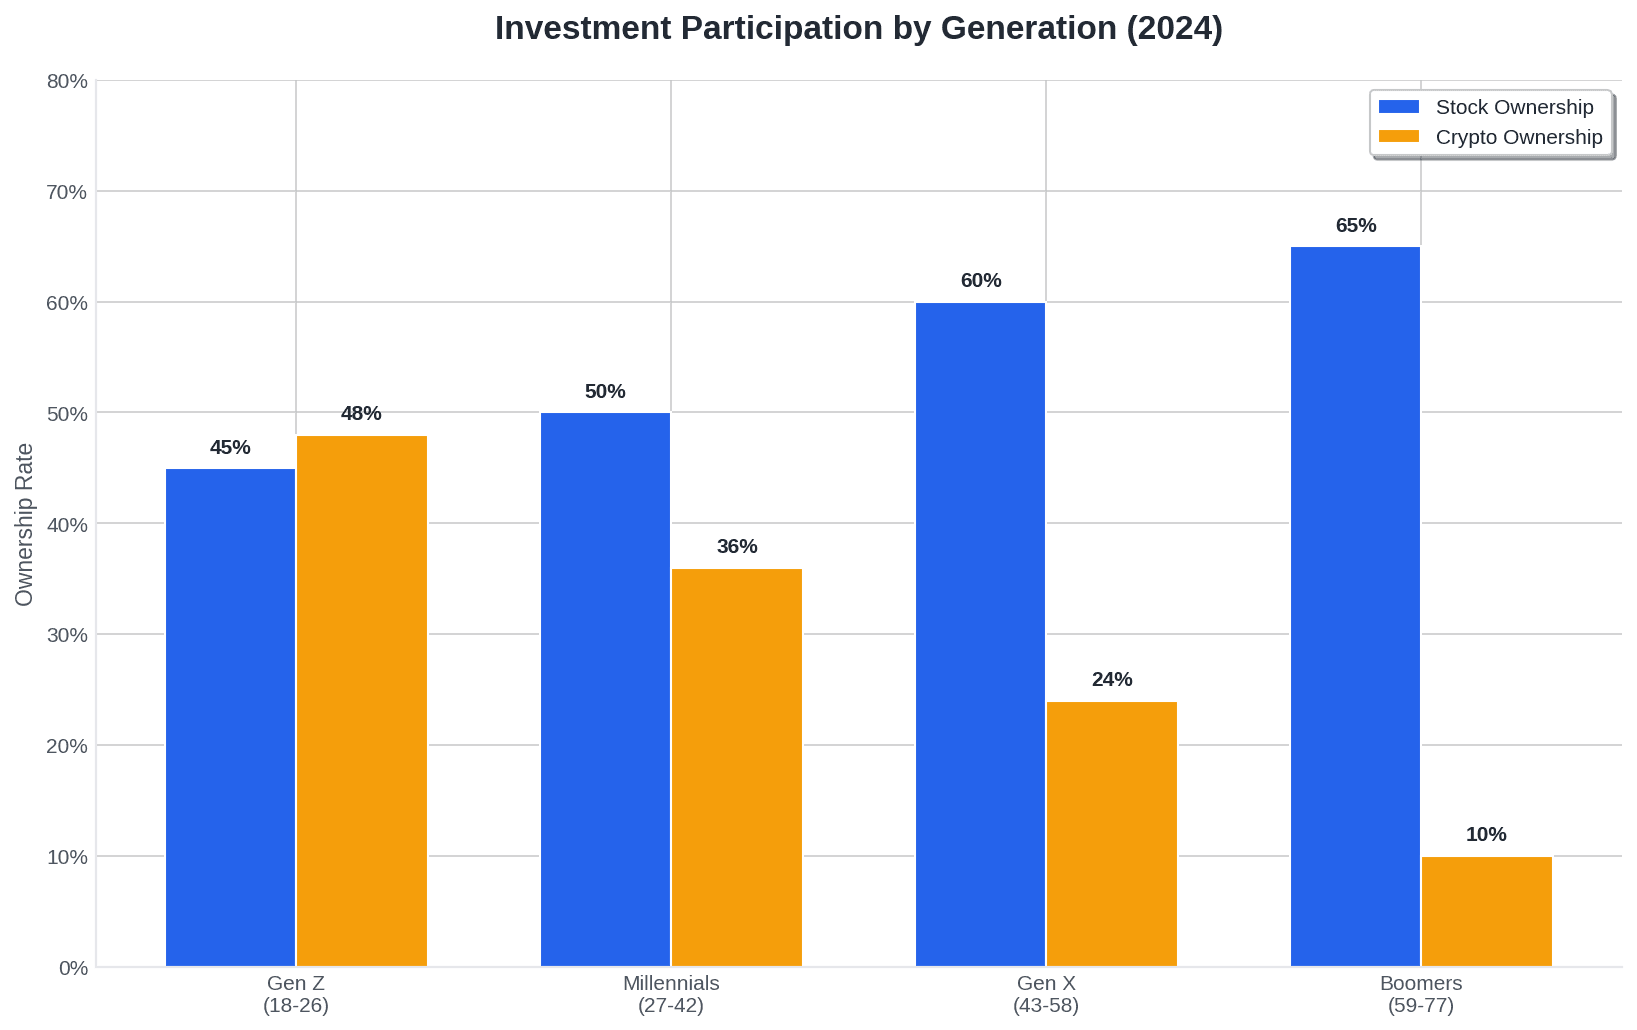
62% of Americans own stocks in some form, but among Gen Z, 42–55% own or have owned crypto — often allocating more than half their portfolio to it.
Problem? Volumes are small and emergency funds are lacking.
But here's the thing — they're investing, learning, experimenting. That's absolutely fantastic!
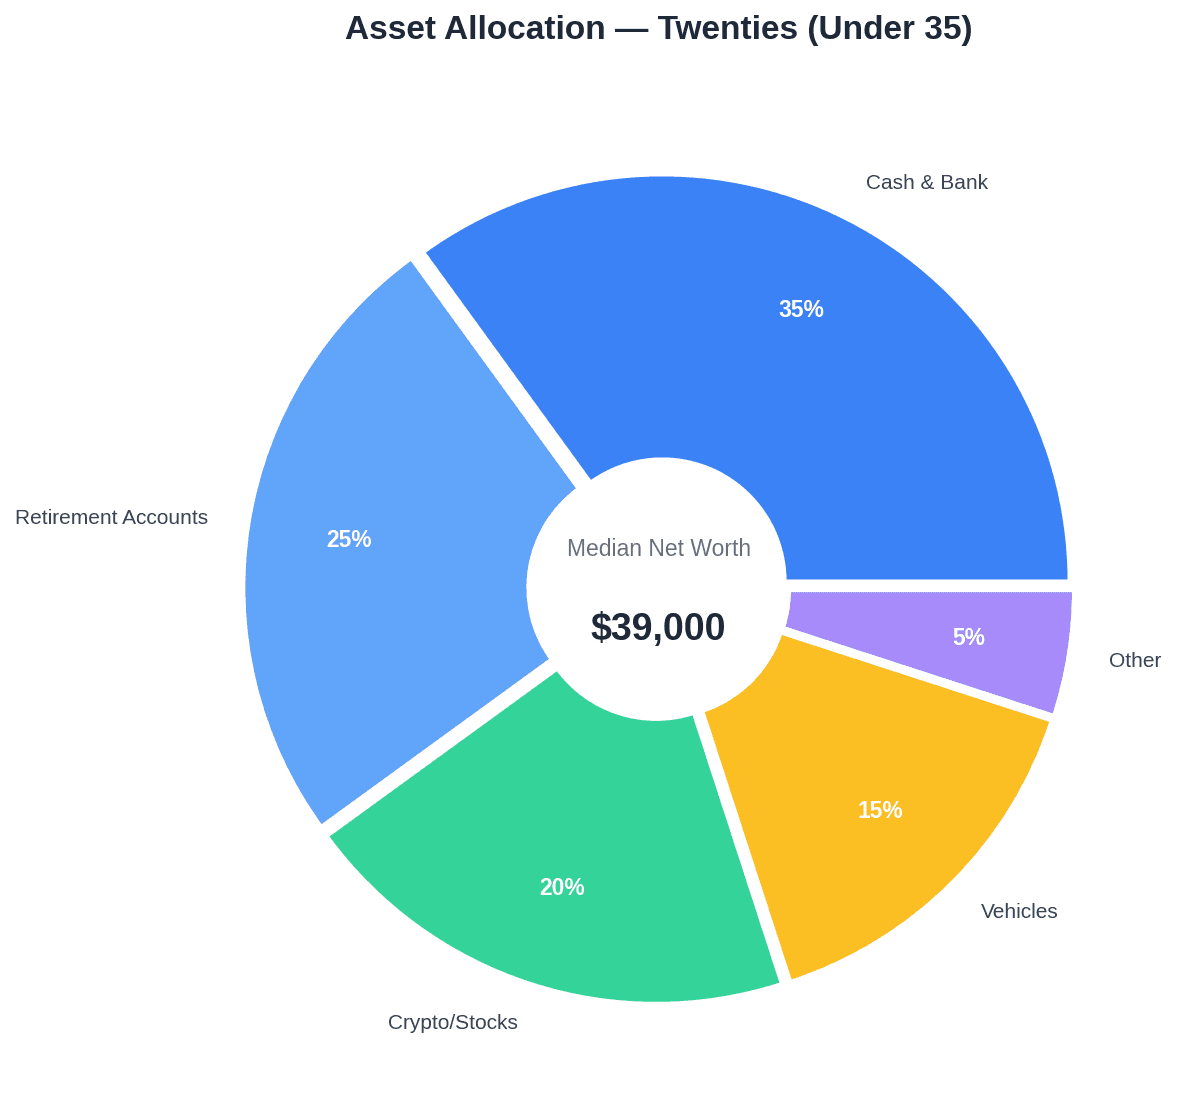
Typical twentysomething:
- Lives in a rental or with parents
- Has tens of thousands in the bank (not hundreds of thousands)
- Invests through apps like Robinhood, Fidelity, Schwab
- High crypto exposure
- Median net worth: $10,200 (under 25) to $39,000 (25–34)
Where you should be:
- Emergency fund covering 3 months of expenses
- Start investing (even $100/month counts)
- No high-interest debt (credit cards, personal loans)
- Average 401(k) balance at 25–29: $24,000
Thirtysomethings (35–44)
The most demanding decade.
Mortgage, kids, career — all at once. And simultaneously the golden era for building wealth.
This age group shows 61% homeownership and the highest growth in net worth from the previous decade.
Typical thirtysomething:
- Paying a mortgage (average home price now $400K+)
- Median net worth around $135,600
- Combining mortgage payments with investments
- Starting to take retirement seriously
- Average 401(k) balance at 35–39: $73,200
Where you should be:
- Own a home (or have a clear plan toward it)
- Emergency fund covering 3–6 months
- Regular investments (ideally 15–20% of income)
- Consumer debts paid off
- Taking full advantage of 401(k) employer match
Fortysomethings (45–54)
Peak earning years have arrived.
But also the highest responsibilities — 45–54 year-olds earn $116,800 median but often have college tuition, aging parents, and mortgages all competing for those dollars.
Typical fortysomething:
- Mortgage roughly halfway paid
- Median net worth $247,200
- More conservative investments
- Highest income of their career
- Average 401(k) balance at 45–49: $152,100
Where you should be:
- Mortgage under control (ideally under 50% of home value)
- Investment portfolio growing steadily
- Maxing out 401(k) contributions ($23,000 limit in 2024)
- Catch-up contributions starting at 50 ($7,500 extra)
- Family properly insured
Fiftysomethings (55–64)
The final big push. Kids are leaving, expenses are dropping.
This is your last major chance to catch up if you haven't been investing.
Typical fiftysomething:
- Mortgage paid off or close to it
- Median net worth $364,500
- Shifting toward safer investments
- Thinking seriously about retirement
- Average 401(k) balance at 55–59: $244,900
Where you should be:
- Paid off or nearly paid mortgage
- 10–15× annual expenses in assets
- Clear retirement plan
- Diversified portfolio (not just real estate)
- Taking advantage of catch-up contributions
Sixtysomethings and Retirees (65+)
Highest absolute wealth, but...
91% of retirees receive Social Security, and 50% depend on it for the majority of their income.
Only 27% have 6+ months of emergency savings. That's concerning.
Typical retiree:
- Paid-off home (main source of wealth)
- Average Social Security benefit: ~$1,862/month ($22,344/year)
- Median net worth: $409,900 (65–74) declining to $335,600 (75+)
- Conservative — savings accounts, bonds, CDs
- Average 401(k) balance at 65–69: $251,400
How Much Do Americans Save?
Here's where it gets rough — the personal savings rate is just 4.6% as of 2024.
That's historically low. Back in the 1960s–70s, it averaged 11.7%. The COVID peak hit 32% in April 2020, but those days are long gone.
On an individual level?
- 24% of Americans have zero emergency savings
- 30% have some savings but less than 3 months of expenses
- 19% have 3–5 months covered
- Only 27% have 6+ months saved
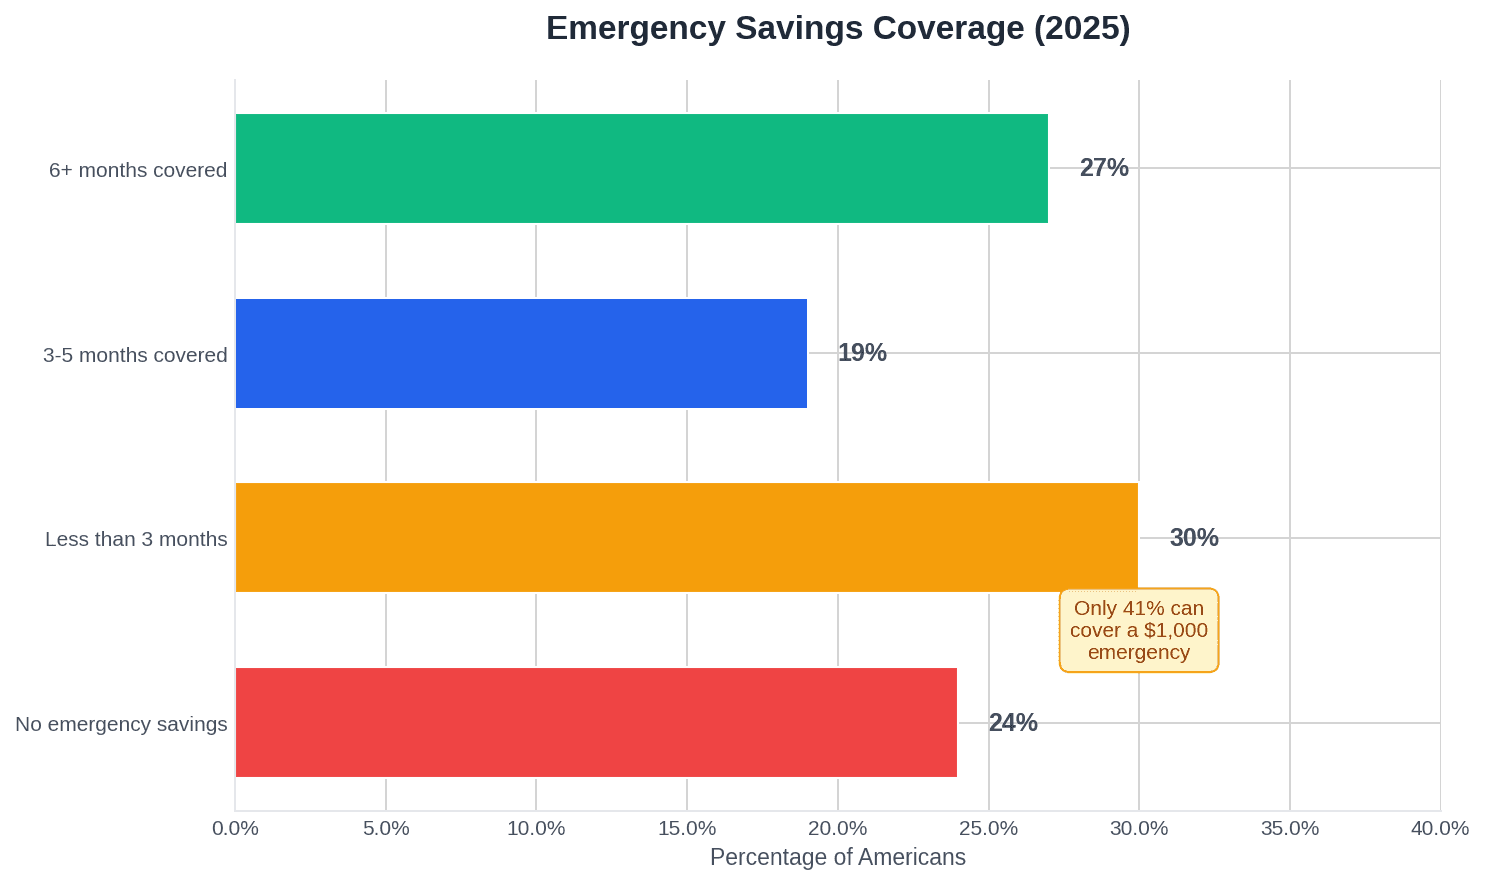
Here's the famous Federal Reserve stat from its Survey of Household Economics and Decisionmaking: only 63% can cover a $400 emergency with cash. For $1,000? Just 30% would pay it from savings, per Bankrate's December 2025 survey (2026 Emergency Savings Report).
So where do you fall?
62% of Americans Own Stocks
According to Gallup's latest stock-ownership survey, 62% of Americans own stocks in some form — up from 52% at the 2013 low but still below the 65% peak in 2007.
But careful — "own stocks" can mean a lot of things, including through a 401(k). Still, this number impressed me!
| Group | Stock Ownership | Main Instruments |
|---|---|---|
| Income $100K+ | 87% | Diversified portfolios |
| College graduates | 84% | ETFs, mutual funds |
| Gen Z (18–26) | 42–55% crypto | Crypto, individual stocks, target-date funds |
| Millennials (27–42) | ~50% | ETFs, index funds, some crypto |
| Gen X (43–58) | ~60% | Mutual funds, growing self-directed |
| Baby Boomers (59–77) | ~65% | Mutual funds, bonds, conservative |
| Income under $50K | 28% | Limited participation |
Young people are leading the charge in new investment approaches. That's great news for their future.
What Does This All Mean?
Three Things You Should Know:
1. Your home isn't everything
45% of wealth in a primary residence is risky. What if you need money? What if the market crashes? Diversify and try to save a bit more than just your mortgage payment.
Even a small step in your twenties makes a huge difference later.
Will Social Security still be there in 30 years?
When I look at current political debates and fiscal realities, I don't know how it'll shake out for today's younger workers.
Setting a little aside isn't that hard, right?
2. Start investing — now
It doesn't matter if you're 25 or 55. Every year you delay costs you more than you think. Compound interest works, but it needs time.
3. Don't compare yourself to the average
The average is skewed. Compare yourself to the median — or better, to your own age group: the net worth percentile calculator by age ranks your exact number against your bracket and shows what it takes to reach the next one.
Actually, scratch that — compare yourself to where you were a year ago.
Conclusion
Financial health isn't a sprint, it's a marathon.
It doesn't matter where you are today. What matters is the direction you're heading.
If you're reading this article and thinking about your finances — you're already doing more than most people.
So let's go.
Have questions? Email me at dennis.vymer@myfinancialfreedomtracker.com.
Sources
- Federal Reserve Survey of Consumer Finances (2022) — net worth by age and overall medians/averages
- U.S. Census Bureau, Income in the United States: 2024 — household income data
- Bureau of Labor Statistics, usual weekly earnings — earnings by age and industry
- Fidelity Q4 2024 retirement analysis — average 401(k) balances by age
- Bankrate Emergency Savings Report — emergency-savings coverage
- Gallup stock ownership survey — share of Americans owning stocks
- Federal Reserve SHED report — $400 emergency-expense statistic
Stay Updated
Get notified about new articles and MFFT build-in-public updates.
Ready to Apply This?
Start tracking your finances today and put these tips into practice.
- Import bank statements in seconds
- AI-powered categorization
- Beautiful visualizations
- Set and track financial goals
Related posts
 Start Here
How Long Will Your Savings Last in Retirement? (Table)
At 4% a year and a 3% real return, savings last about 44 years; at 6%, about 22. Two bad years at the start can cut a 37.4-year plan to 21.5.
 Start Here
One More Year Syndrome Starts the First Time You Raise Your FIRE Number
Our daughter is the first thing in five years I'd accept as a reason to change our FIRE number. One more year syndrome doesn't wait for the finish line: it starts the first time a good market year talks you into a bigger target. Market moves the date. Life moves the number.
 Start Here
Retire Early Abroad: Why the Cheap-Country Discount Shrinks
Moving somewhere cheaper does cut your FIRE number, by less than advertised and not for good. A view from Czechia, one of the countries on those lists.
 Start Here
Lean FIRE vs Fat FIRE: Price Your Spending Floor First
Top pages can't agree if fat FIRE starts at $100,000 or $200,000 a year. The tier is an output: price your spending floor first, then see which FIRE fits.
 Start Here
I Want Free Wednesdays at 40. I Can Buy One This Friday.
I'm saving for free Wednesdays twelve years out and had never once asked what one costs today. So I ran it: on my own model a four-day week at 80% pay delays financial independence by 21 to 49 months. And if your spending falls with your income, by exactly nothing.