Safe Withdrawal Rate 2026: Is the 4% Rule Still Right?
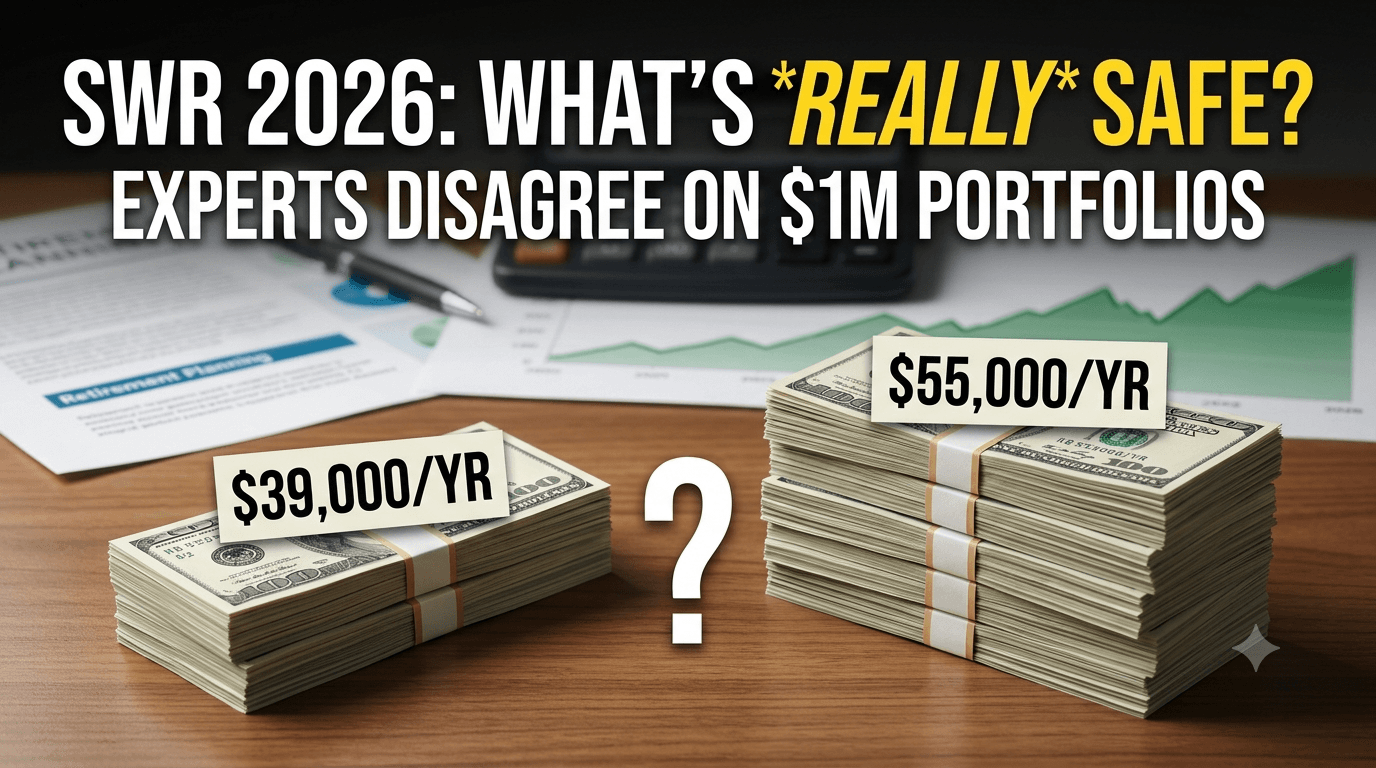
Two of the most respected names in retirement research looked at the same question this year — how much can a 2026 retiree safely pull from a $1 million portfolio? — and gave answers $16,000 a year apart.
Morningstar, in its December 2025 research, says the safe withdrawal rate for someone retiring in 2026 is 3.9% (up from 3.7% in 2025). That's $39,000 a year on a million dollars.
Bill Bengen — the financial planner who invented the 4% rule back in 1994 — argues in his August 2025 book A Richer Retirement that most retirees can safely start at 4.7%, and 5.25%–5.5% if they stay flexible. That's $47,000 to $55,000 a year on the same million.
So which is it — is the safe withdrawal rate 2026 retirees should use under 4%, or pushing 5.5%? Both numbers come from serious people running serious math, and almost no article online has bothered to reconcile them.
The short answer: they're both right, because they're answering different questions. Once you understand why they disagree, you stop chasing a magic number and start finding your number — the one set by how long you'll be retired, what your portfolio holds, and how flexible you're willing to be.
There's also a twist in the June 2026 data that flips the usual fear on its head: for most savers, the real danger isn't running out of money. It's dying with a fortune you were too scared to spend.
Quick honesty up front: this is how I think about it, not financial advice — and you'll notice I don't put my own numbers in here. "Enough" is genuinely different for everyone, and a withdrawal rate that fits my plan would be the wrong starting point for yours. What I can do is show you the math both camps are running, because the thing I can't stand in finance tools is a confident number with the reasoning hidden. Once you can see why the experts disagree, you stop hunting for a magic rate and start building your own.
Key takeaways
- The 2026 numbers genuinely disagree: Morningstar says 3.9%, the classic rule says 4%, and Bengen now says 4.7% to start (up to ~5.5% if you stay flexible). They differ because they answer different questions — historical worst-case vs. forward-looking, rigid vs. flexible.
- Your safe rate isn't universal. It's set by three things: how long you'll be retired, what your portfolio holds, and how willing you are to flex spending in a bad year.
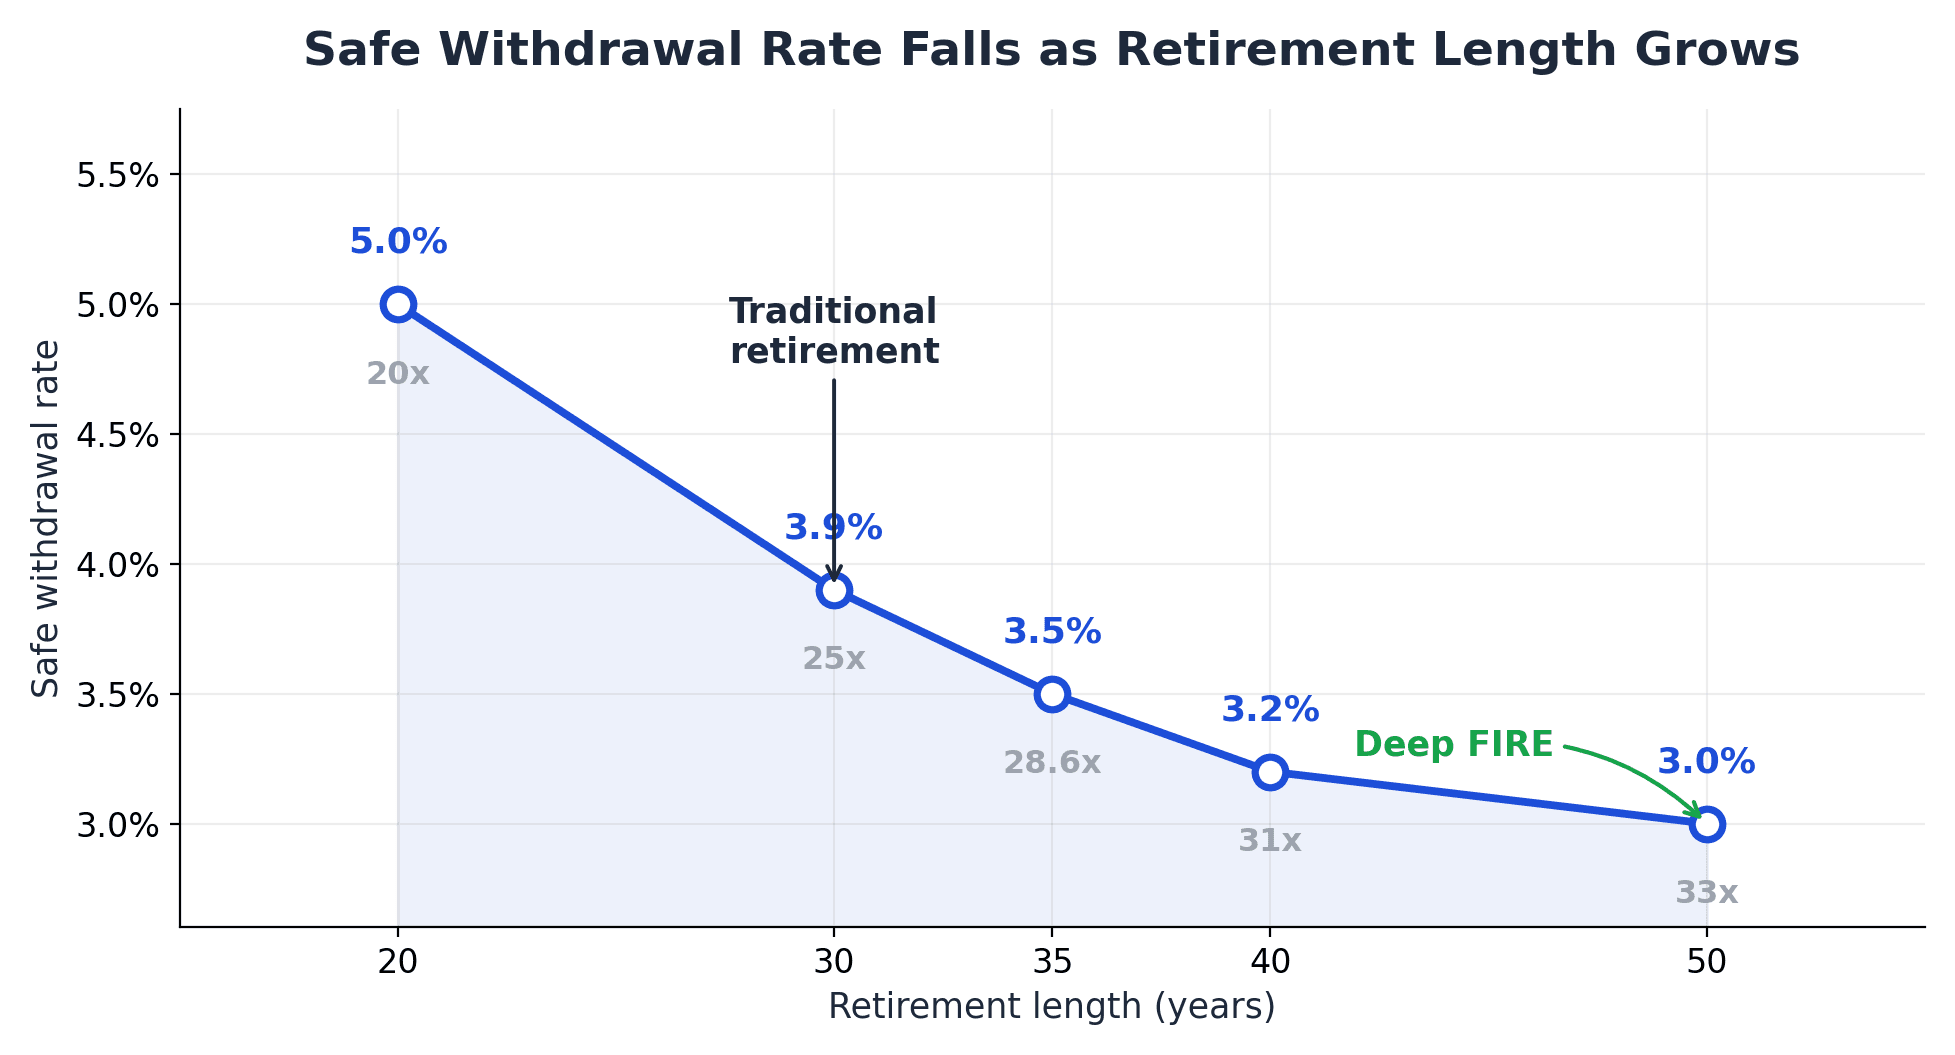
- Longer retirement means a lower rate: roughly 5% for a 20-year retirement, 3.9% for 30 years, and about 3.2% once you're planning 40+ years of deep FIRE.
- Guardrails change the math. Pre-commit to trimming spending after bad years (the Guyton-Klinger approach) and you can responsibly start north of 5%.
- The sneaky risk is underspending, not running out. Under a plain 4% rule the median retiree dies with about 2.8x their starting balance — a life under-lived, not a portfolio over-drawn.
The 4% Rule, in One Minute (and Where It Came From)
If you've spent any time around the FIRE community, you've met the 4% rule. But let's make sure we're starting from the same place.
In 1994, a financial planner named William Bengen ran a simple, powerful experiment. He took every 30-year period in U.S. market history and asked: what's the highest percentage a retiree could have withdrawn in year one — then adjusted that dollar amount up with inflation every year after — without ever running out of money, even if they retired at the worst possible moment?
The answer came out to 4.15%, rounded to 4%. The worst-case start year was 1968, on the eve of a brutal stretch of stagflation. Bengen named this number the SAFEMAX — the safe maximum starting withdrawal rate. The follow-up Trinity Study confirmed it: a 4% inflation-adjusted rate survived 95% of rolling 30-year periods on a 50/50 portfolio.
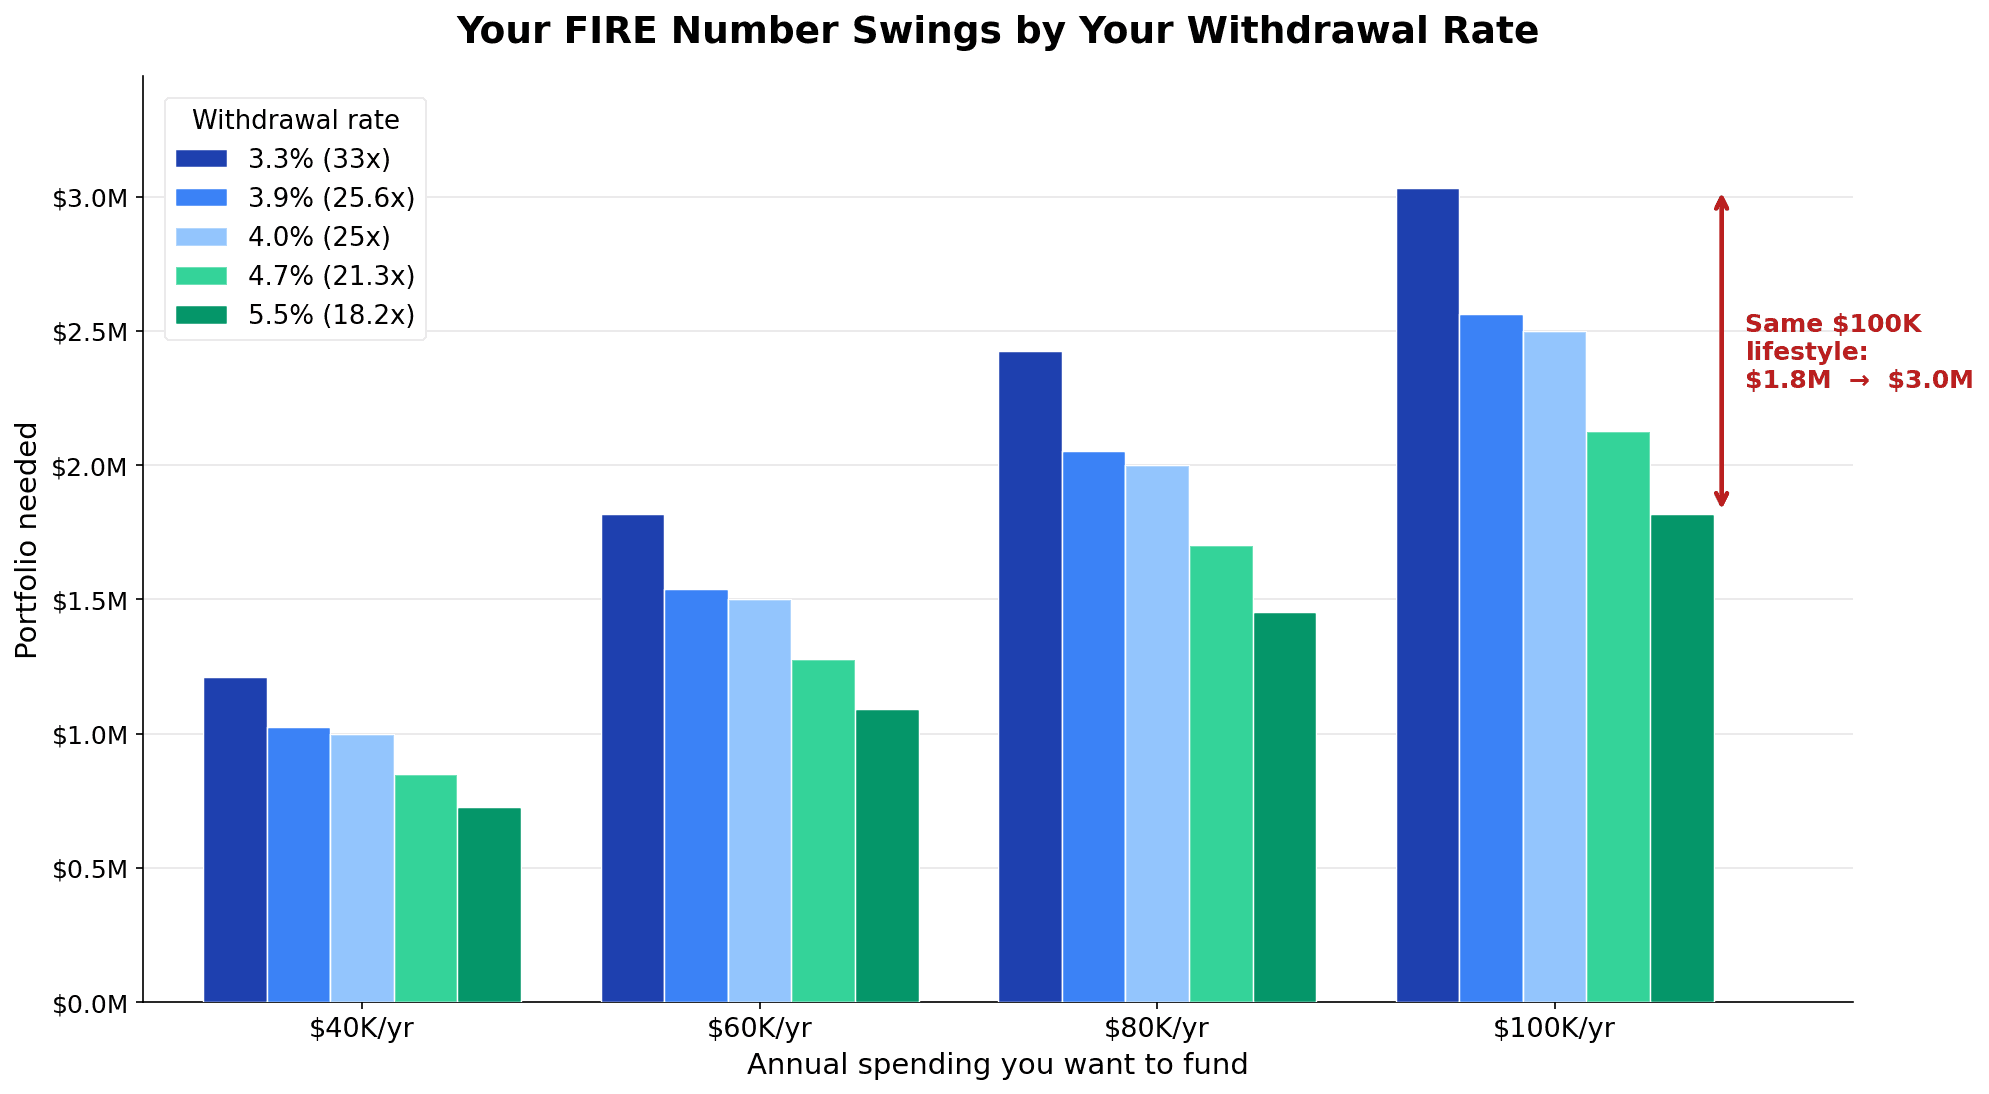
From the 4% rule comes the famous shortcut, the 25x rule: if 4% covers your spending, your portfolio needs to be 25 times your annual expenses. Spend $40,000 a year? You need $1,000,000 (40,000 ÷ 0.04). That one number is the foundation almost every FIRE plan rests on — the FIRE movement primer walks through the savings-rate math behind it.
The catch: the 4% rule was never meant as a recommendation. Bengen designed it as a floor for the unluckiest retiree in a century. Using a worst-case number as your everyday plan is like buying a house built for a Category 5 hurricane and then refusing to open the windows on a sunny day. Which brings us to 2026.
2026 Just Broke the Consensus: 3.9% vs 4.7% vs 5.5%
For about three decades, "4%" was the boring, settled answer. In 2026, the consensus cracked into three pieces at once.
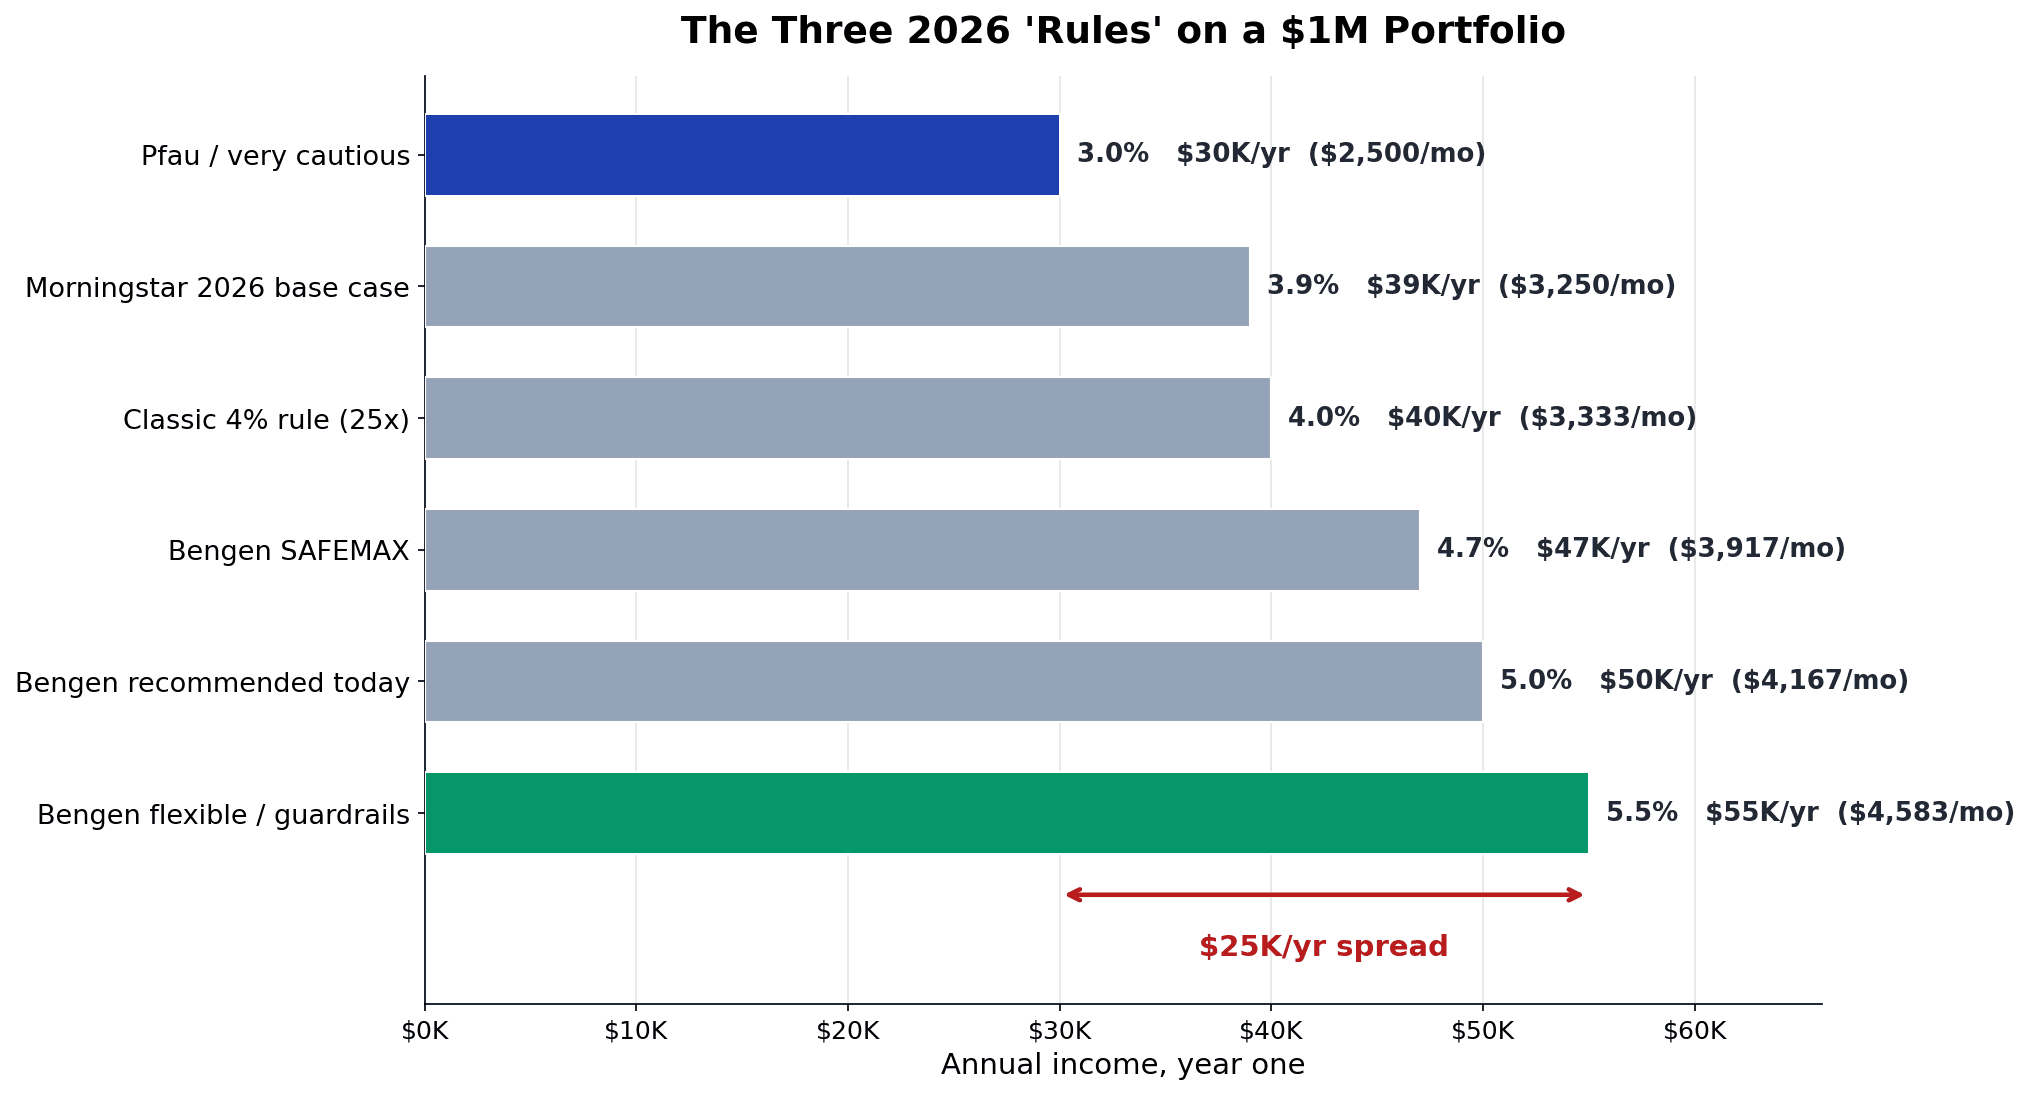
Here are the three numbers on the table right now, side by side:
| Source / view | 2026 rate | Year-1 on $1M | What it represents |
|---|---|---|---|
| Morningstar 2026 base case | 3.9% | $39,000 | Forward-looking, 90% success over 30 years, fixed inflation-adjusted spending |
| Classic 4% rule (Trinity) | 4.0% | $40,000 | The historical worst-case anchor everyone knows |
| Bengen's new SAFEMAX | 4.7% | $47,000 | The revised worst case, with broader diversification |
| Bengen recommended today | ~5.0% | $50,000 | His real-world starting point for most retirees |
| Bengen flexible | 5.25%–5.5% | $52,500–$55,000 | For retirees willing to adjust spending |
Notice both camps recently raised their numbers — Morningstar lifted its 2026 figure from 3.7% to 3.9% as bond yields improved, and Bengen raised his floor from 4.15% to 4.7% in 2025 after widening the portfolio to include small-cap and international stocks. Yet they still land in different neighborhoods. Morningstar says start at 3.9%; Bengen says you're leaving money on the table below 5%.
That's no rounding error. On $1 million, the gap between 3.9% and 5% is $11,000 a year — compounded with inflation over 30 years, it's six figures of lifestyle you either lived or didn't.
Meet Sarah, who retires at 65 with exactly $1,000,000.
- At Morningstar's 3.9%, she draws $39,000 in year one — about $3,250 a month.
- At the classic 4%, $40,000 — $3,333 a month.
- At Bengen's 4.7% SAFEMAX, $47,000 — $3,917 a month.
- At Bengen's flexible 5.5%, $55,000 — $4,583 a month.
Same portfolio, same retirement date, a $16,000-a-year swing — depending entirely on whose "rule" Sarah believes. So let's figure out why they disagree, because that's the part that tells you which number to trust.
Why the Safe Withdrawal Rate Numbers Disagree: Backward-Looking vs Forward-Looking
The gap between 3.9% and 5.5% isn't a fight over arithmetic. It's a fight over which future you assume.
Bengen looks backward. His method asks: what's the worst that has ever actually happened in 100+ years of U.S. history? Even the 1968 retiree, walking straight into stagflation, survived on 4%. So the argument is: the worst case already happened, we measured it, and with broader diversification it's now 4.7% — meaning a typical retiree (not the unluckiest in a century) can start higher, near 5%. His historical average safe rate across all start years is about 7%. Four percent was always the panic floor, not the plan.
Morningstar looks forward. Instead of replaying history, it runs thousands of Monte Carlo simulations on today's conditions — which are unusual. The Shiller CAPE ratio (how expensive stocks are versus their 10-year average earnings — the "cyclically adjusted price-to-earnings" ratio) sits around 40 in June 2026, against a long-run average near 17. We're close to the dot-com peak, and high valuations historically mean lower future returns, which pulls the safe rate down. Morningstar's 3.9% bakes in that headwind at a strict 90% success rate.
Wade Pfau pushes further still: he argues high valuations imply a genuinely safe rate closer to 3%, and only a 65–70% chance a rigid 4% works for someone retiring today.
So you have a spectrum:
| View | Safe rate | Core assumption |
|---|---|---|
| Pfau (forward, pessimistic) | ~3.0% | High CAPE means weak future returns |
| Morningstar (forward, base case) | 3.9% | Monte Carlo, 90% success, lower expected returns |
| Bengen (backward, worst case) | 4.7% | The actual worst case in history, diversified |
| Bengen (backward, typical) | ~5.0–5.5% | You're probably not the unluckiest retiree ever |
Both methods are legitimate. The backward-looking camp says "the future can't be worse than the worst past." The forward-looking camp says "this starting point is more expensive than almost any past, so be careful." Which one fits you depends on a few personal variables — and the single biggest one is time.
The Variable That Changes Everything: How Long Will You Be Retired?
Every clickbait headline about "the right withdrawal rate" ignores one thing: a 65-year-old and a 45-year-old aren't playing the same game.
The 4% rule was built for a 30-year retirement (retire at 65, plan to age 95). But a FIRE retiree walking away at 45 to live until 95 is funding a 50-year retirement — and the math at 50 years is meaningfully tougher. The longer your money must last, the lower your safe starting rate and the bigger the portfolio multiple you need:
| Retirement length | Approx. safe rate | Multiplier (× annual expenses) |
|---|---|---|
| 20 years | ~5.0% | 20× |
| 30 years (traditional) | ~3.9–4.0% | 25× |
| 35 years | ~3.5% | 28.6× |
| 40 years | ~3.2% | ~31× |
| 45 years | ~3.2% | ~31× |
| 50 years (deep FIRE) | ~3.0–3.25% | 31–33× |
Morningstar's own work shows stretching the horizon from 30 to 35 years drops the safe rate from 3.9% to 3.5% — and out to 40 years, to just 3.2%. Even Bengen lands around 4.2–4.3% for 40-to-50-year horizons — well below his 5% headline for a standard retirement.
This is the part that hits home for me personally. I'm not planning to slam the brakes at a traditional 65 — my own version of freedom is optionality, the room to choose work rather than need it, and I'd rather reach that around 40 and let the portfolio keep compounding into my 50s, partly because of the kids. But a longer runway is exactly the case where the comfortable 4% headline quietly stops applying. The longer you want the money to last, the more the forward-looking, lower-rate camp deserves your attention — which is why I anchor my own thinking toward the conservative end of these tables, not the headline.
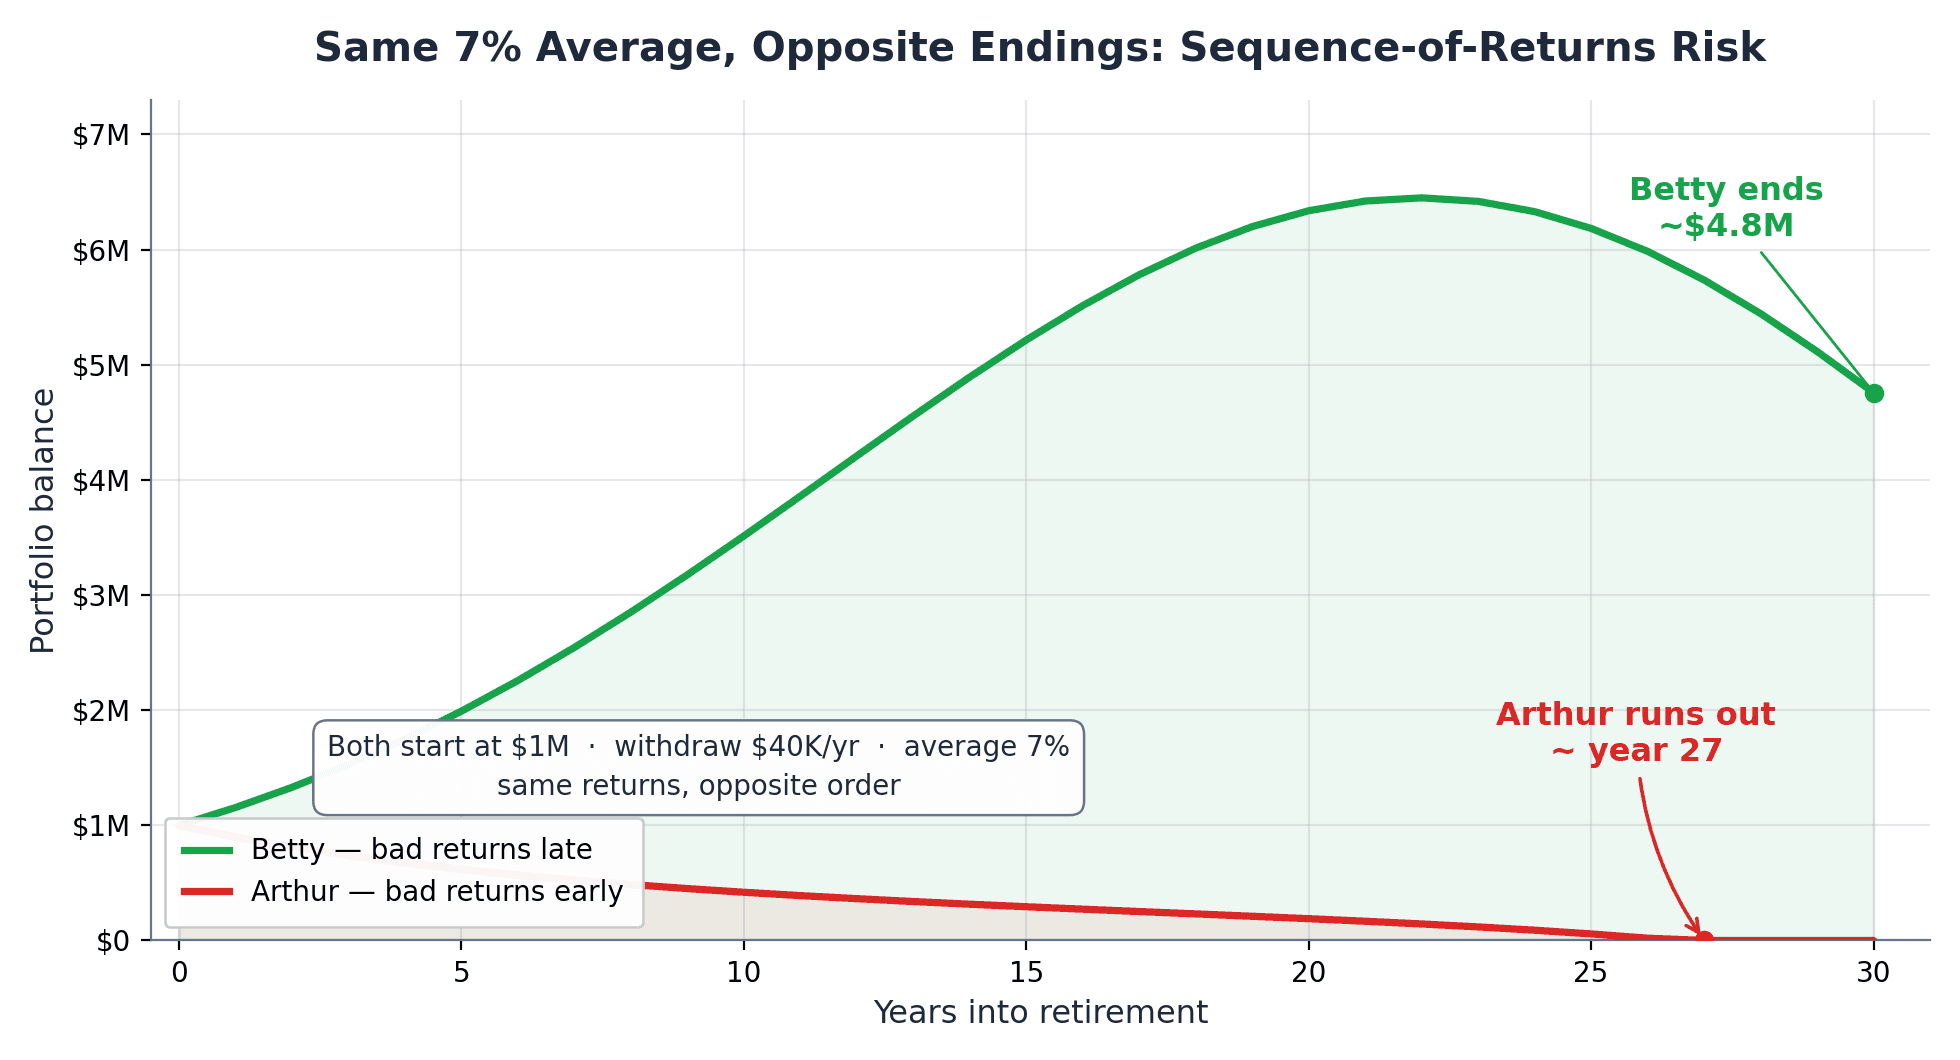
There's a second, sneakier reason long horizons are dangerous: sequence-of-returns risk — the order in which your returns arrive. It's the mechanism that quietly breaks otherwise reasonable plans.
Meet Arthur and Betty. Both retire at 66 with $1,000,000, both withdraw $40,000 a year, and both run the exact same set of 30 annual returns — so both average exactly 7%. The only difference is the order those returns arrive in.
- Arthur hits bad markets in his first few years. He's forced to sell shares at depressed prices to fund his $40,000 — and $40,000 from a portfolio that's fallen to $600,000 is a 6.67% bite, not 4%. His money is gone by year 27.
- Betty gets lucky early — strong double-digit gains in her first several years. Her bad markets arrive late, after her balance has already compounded into a huge cushion. She peaks near $7.8M, and even after a rough final stretch she finishes with about $4.6 million — the very same returns as Arthur, just in a kinder order.
Same average return, same withdrawals, opposite endings — purely because of when the bad years hit. (Betty's enormous surplus is also a preview of the next section: the bigger danger for disciplined savers usually isn't running dry — it's dying with millions unspent.)
This is why retirement's early years carry outsized weight, and why FIRE retirees need extra defenses — I go deep on the cash-bucket and bond-tent moves in the Sequence of Returns Risk playbook. And if you're still accumulating and unsure which multiplier to target — 25x, 28.6x, or 33x — Coast FIRE shows how to back into the number and let compounding finish the job.
Guardrails: How to Spend 5%+ Without Going Broke
So far it looks like a trade-off: spend more and risk ruin, or spend less and stay safe. But a third path lets careful retirees start near 5% — sometimes higher — without scary risk. It's called using guardrails.
The static 4% rule has a fatal flaw: it withdraws the same inflation-adjusted amount no matter what the market does. Pulling your full planned amount during a 40% crash is precisely what sinks the unlucky retiree.
Guardrails make your spending respond to your portfolio. The best-known version is the Guyton-Klinger system (2006): you pre-commit to a couple of rules that nudge spending down a little after bad years and up after good ones. Because you've agreed in advance to flex, you're allowed to start higher. Here's a clean version on a 5% start:
| Zone | Trigger | Action |
|---|---|---|
| Upper guardrail (capital preservation) | Your current rate climbs more than 20% above the start — i.e., above 6.0% | Cut that year's withdrawal by 10% |
| Target band | Current rate stays within ±20% of start (4.0%–6.0%) | Keep spending, add inflation |
| Lower guardrail (prosperity) | Your current rate falls more than 20% below the start — i.e., below 4.0% | Give yourself a 10% raise |
| Inflation rule | Portfolio lost money last year | Skip that year's inflation bump |
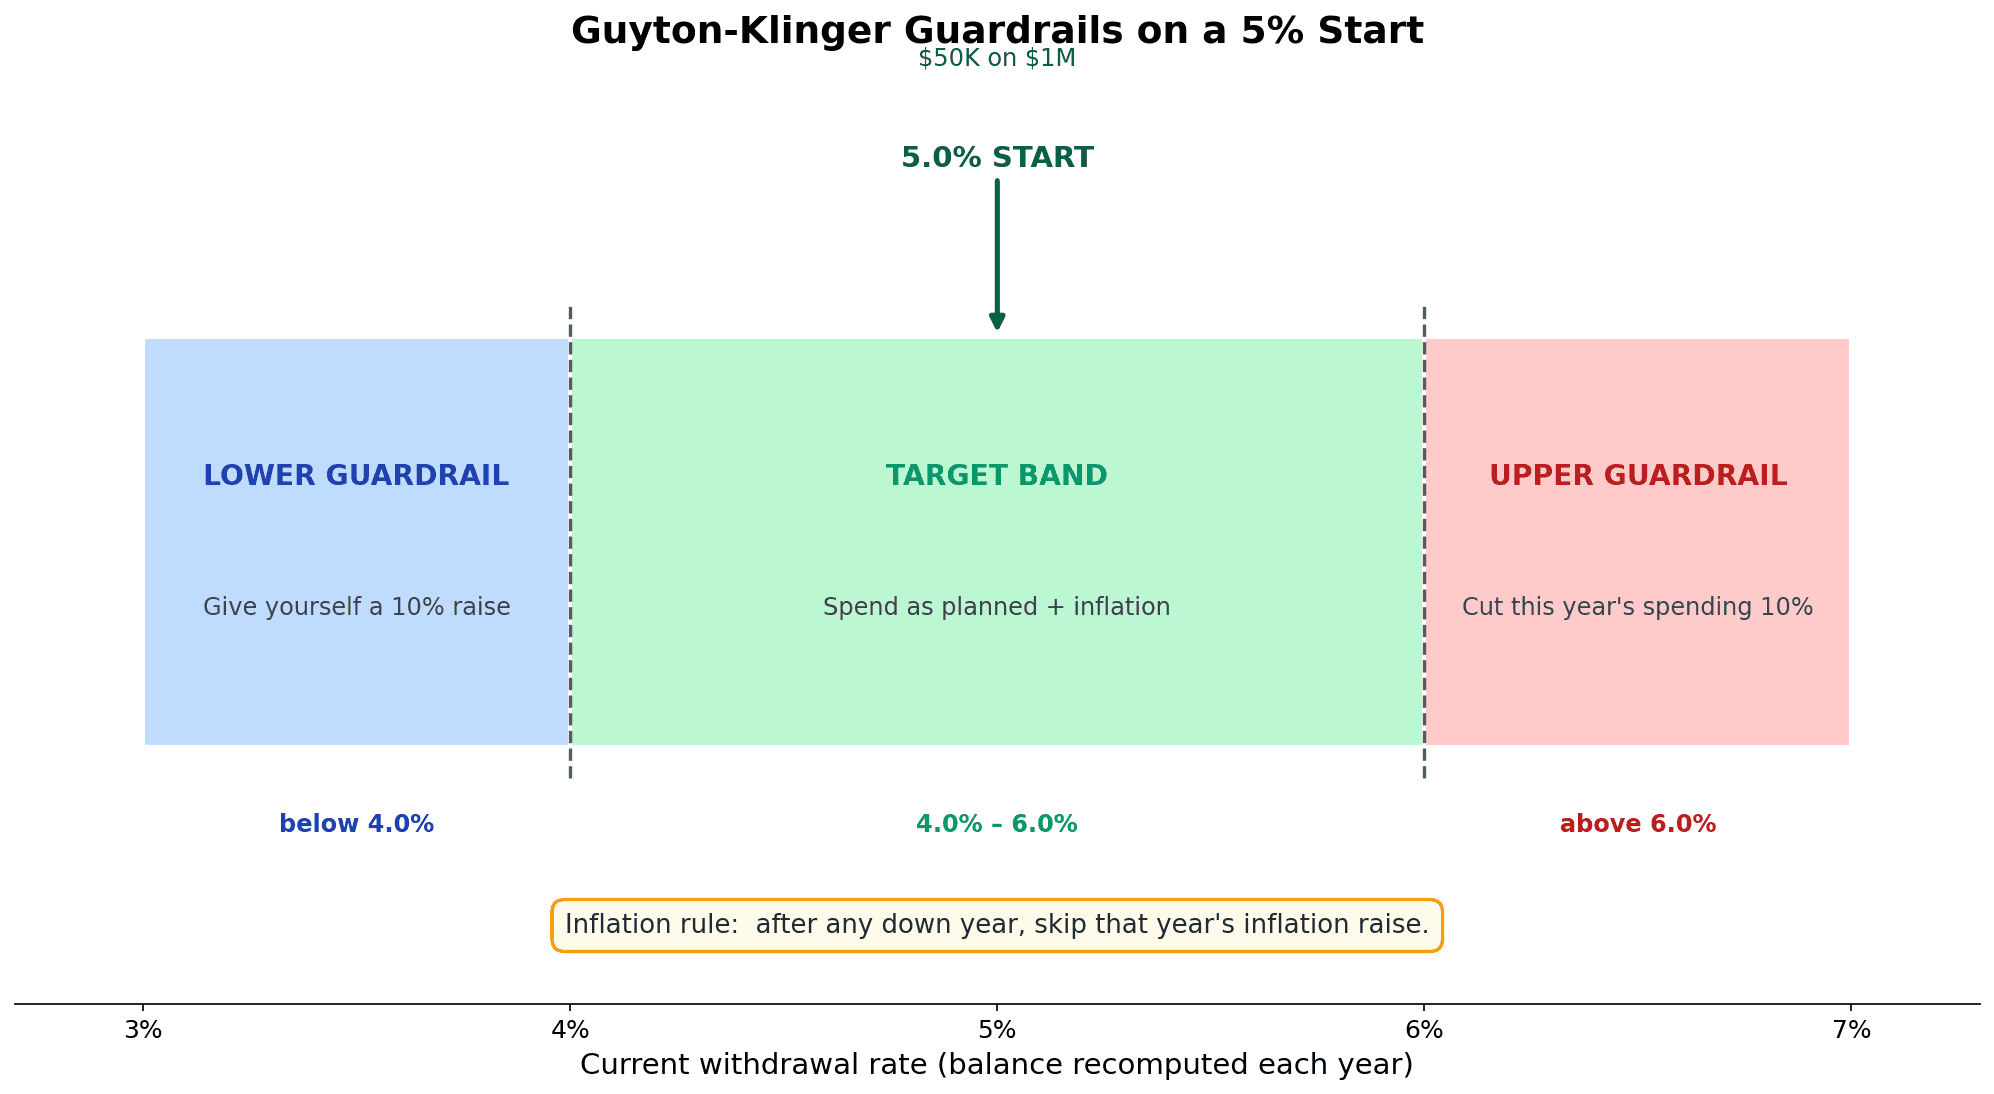
Walk it through with Dave, who starts at 5% on $1 million — a $50,000 withdrawal. Markets fall, his balance shrinks, and his $50,000 is now more than 6% of what's left: that trips the upper guardrail, so he trims 10% for a year to protect the nest egg. Later a long bull market lifts his balance until his withdrawal is under 4% of the total: that trips the lower guardrail, so he takes a 10% raise. Dave spent more in good years and protected himself in bad ones — exactly what a frozen 4% can never do.
Morningstar's research backs this up: of eight flexible strategies it tested, the most aggressive guardrail approaches pushed the safe starting rate to 5.7%, and Vanguard found its dynamic-spending rule lifted success rates about 23% versus the rigid method.
The engine that makes guardrails work is a cash buffer. Hold 1–2 years of spending in cash or short bonds and you're never forced to sell stocks into a crash. A CD ladder is one of the cleanest ways to build that bucket, especially with the Fed cutting through 2026. One catch: guardrails only work if you'll actually pull the trigger — the 10% cut in a scary year is the whole point. Decide now, in writing, what you'll trim first.
The Surprise Risk Nobody Warns You About: Underspending
Now the plot twist. Everything above assumes your biggest fear is running out of money. For most diligent savers, that fear is real — and largely misplaced.
Fresh 2026 data tells a startling story. A MetLife survey found 51% of retirees fear running out — up from 30% a decade ago. Yet the Employee Benefit Research Institute (EBRI) found roughly 1 in 3 retirees reach their mid-80s with 100% or more of their original savings still intact, and 31% of the highest-asset group still had everything — or more — two decades in.
Read that again. A third of retirees spend two decades terrified of a cliff they never approach. They don't run out of money. They run out of life first.
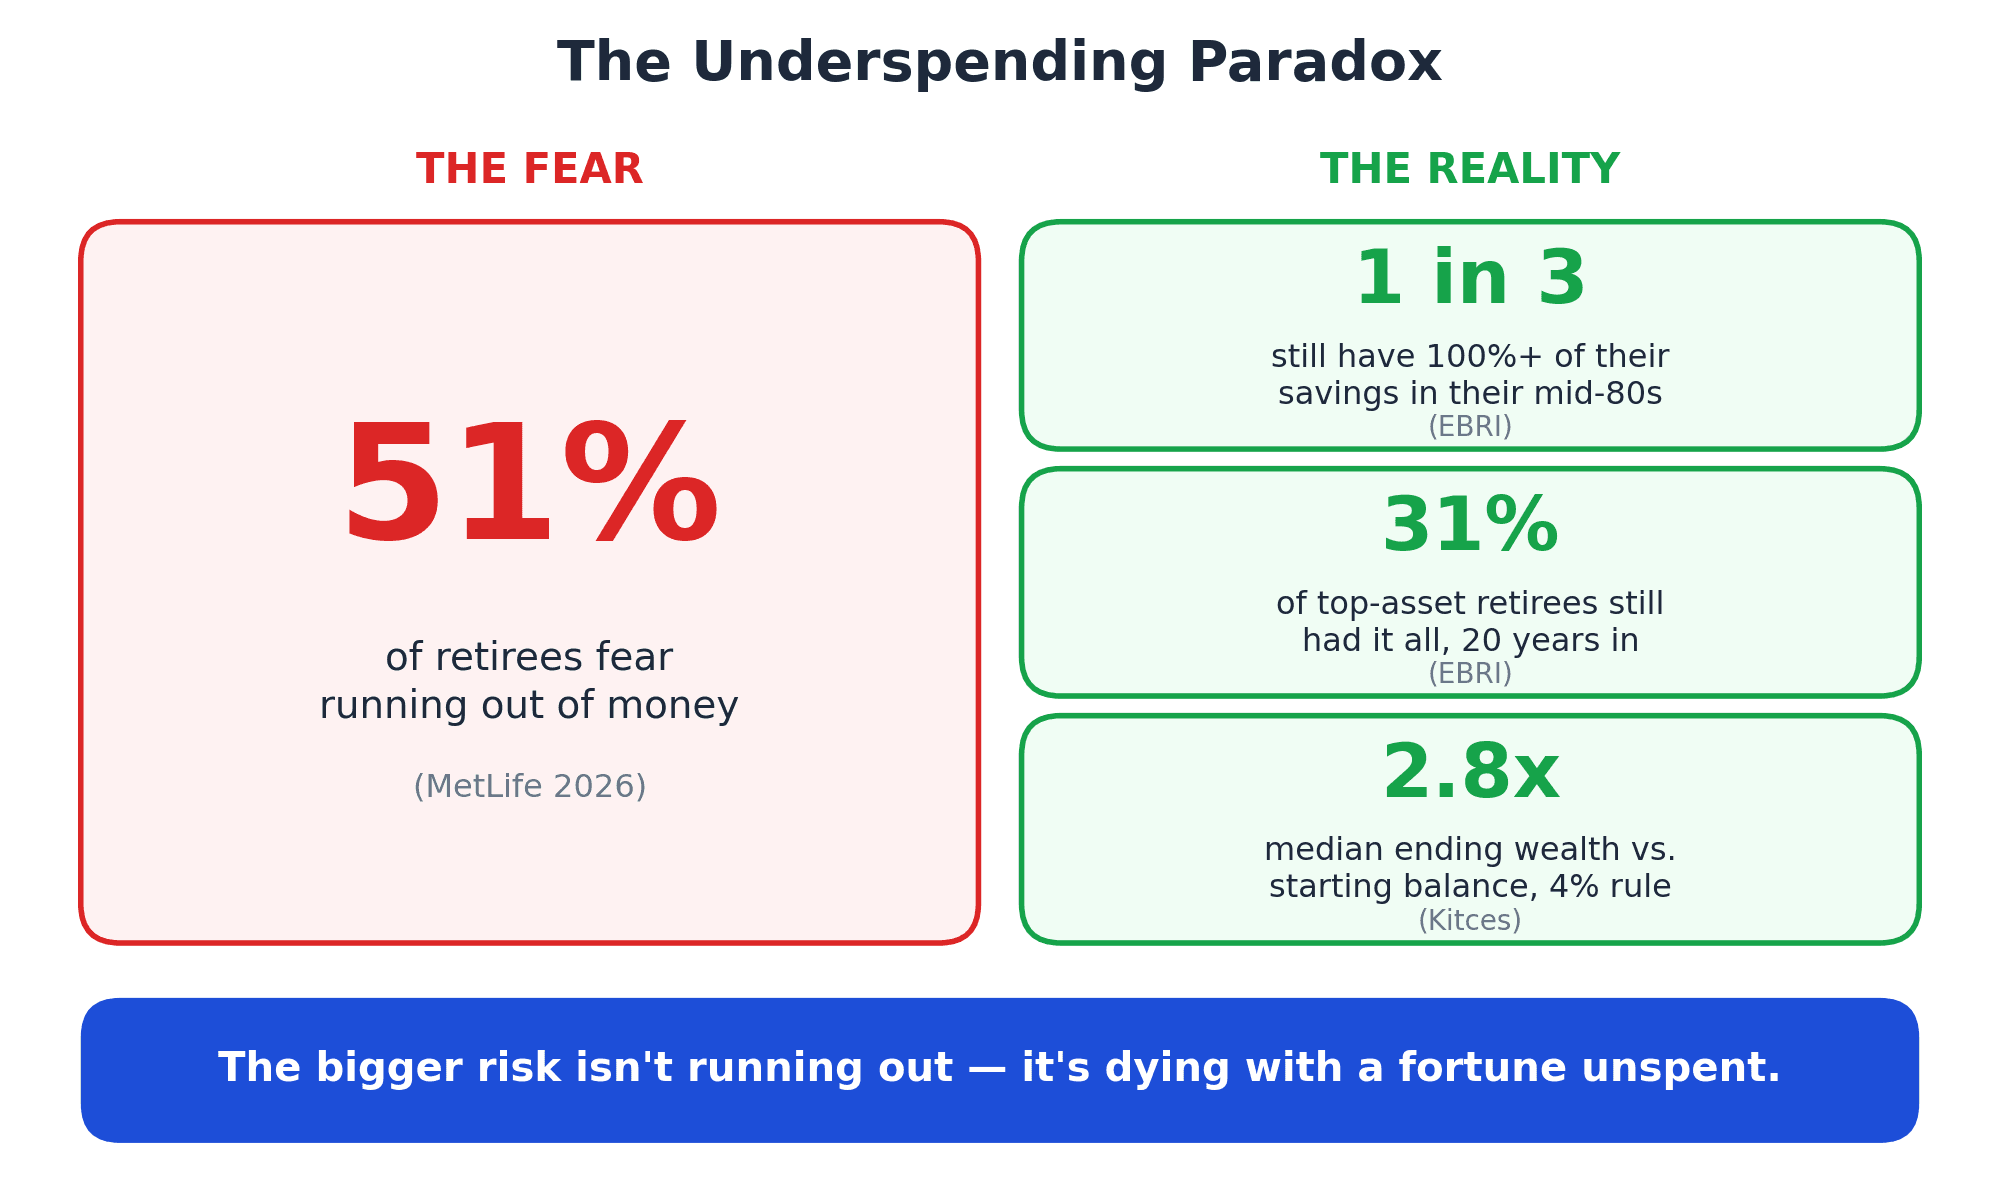
The math confirms how lopsided this is. Michael Kitces found that under the plain 4% rule, the median retiree finishes 30 years with about 2.8 times their starting principal. The rule meant to protect you from poverty far more often leaves a giant unspent pile.
I'll admit this is the trap I have to watch in myself. I'm wired to save — our household rate has sat in the 40–60% range for years — and the same discipline that builds the number makes it genuinely hard to switch into spending it. But for me the entire point of the money is optionality: funding a life, the trips and the generosity, not winning a high score on a balance I never touch. Seeing that median 2.8x pile is a useful slap in the face — if your own number keeps climbing year after year, that isn't a victory to defend, it's permission you've already earned.
Why? Spending down savings after a lifetime of building them is psychologically brutal. EBRI's Craig Copeland put it plainly: "Some people spent all their life saving money, and it's very hard to switch to spending their assets down." And the cost is steep — as CFP Marianela Collado told CNBC in June 2026, underspending "represents a life not lived — the vacations you didn't take because you were afraid you were going to run out of money."
There's also a structural reason you can likely spend more than you think: real retiree spending naturally declines. David Blanchett's "spending smile" research shows inflation-adjusted spending falls about 1% a year — the average retiree spends roughly 26% less at 84 than at 65. Planning for flat spending forever systematically makes people over-save.
This is the philosophical other half of the math, and the heart of the Die With Zero vs FIRE debate — the goal of money is to fund a life, not to maximize the balance on a tombstone. So the real question isn't only "will I have enough?" but "am I so cautious that I'm giving up the trips and generosity I actually saved for?"
Find Your Safe Withdrawal Rate: A 5-Question Personal Checklist
There's no universal safe withdrawal rate. There's your rate, and it falls out of five honest questions.
1. How long will you be retired? This sets your baseline. Roughly: 30 years → start near 4% (25×); 35–45 years → 3.5% (28.6×); 50+ years of deep FIRE → 3.25–3.5% (30–33×). Start here, then adjust.
2. What's your portfolio mix? Too conservative and you can't outrun inflation; too aggressive and a crash in your first decade can sink you. Bengen's updated model uses roughly 55% diversified stocks / 40% intermediate Treasuries / 5% T-bills. If you're sitting in mostly cash or mostly a single stock, your safe rate is lower than the tables suggest.
3. Do you have a guaranteed-income floor? This is the most overlooked lever. If Social Security, a pension, or an annuity covers your essential expenses (housing, food, insurance, healthcare), then your withdrawal rate only has to fund the discretionary gap — and you can run it higher. EBRI found retirees with guaranteed income spend their portfolios far more confidently. Cover the floor first; gamble only with the surplus.
4. How flexible is your spending? If you can cut 10% in a bad year without real pain, guardrails let you start near 5%. If your budget is bare-bones with no give, stay closer to the 3.9–4% floor, because you won't be able to absorb a forced cut.
5. What's your risk tolerance — honestly? Not how brave you feel in a bull market, but how you'll behave when your portfolio is down 35% and the headlines scream. If you'll panic-sell, a lower starting rate and a bigger cash bucket buy the room to stay invested.
Add it up. A 67-year-old with a pension covering most expenses, a balanced portfolio, and flexible spending can comfortably run 5%+. A 45-year-old FIRE retiree with no pension, a 50-year horizon, and a tight budget should anchor near 3.25–3.5%. Same year, same market — wildly different right answers.
From Percentage to Paycheck: Turning Your Rate Into Monthly Income
A percentage is abstract; a paycheck is real. The formula is simple:
Your rate × your current portfolio ÷ 12 = your monthly "paycheck."
Meet Jake. He has $1,200,000 and, after the five questions, settles on a 5% starting rate with guardrails.
- Year one: 5% × $1,200,000 = $60,000, or $5,000 a month.
- If inflation runs 3%, year two becomes $61,800 — about $5,150 a month — regardless of what the market did.
That's the rigid approach: set the dollar amount, bump it by inflation, ignore your balance. Simple, but it's exactly what creates sequence-of-returns danger, forcing the same withdrawal whether the portfolio is up or down.
The smarter move is to recompute against your actual portfolio every January. If markets soared and Jake's balance is $1.4 million, 5% gives him a $70,000 raise (the lower guardrail). If it fell to $1 million, his rate-based draw is $50,000 and his guardrails tell him whether to trim. Either way the number tracks reality, not a guess from years ago.
This is where tracking matters. You can't run a dynamic strategy — or even notice you're underspending — without knowing your current net worth. Watching the balance is the whole game: if it keeps climbing into your 70s and 80s, that's a green light, not a trophy to guard — it means you've earned the room to spend more. The Net Worth by Age benchmarks show median and average figures by decade so you can see where you stand before the withdrawal phase even begins. And revisit your rate every 2–3 years — if CAPE, inflation, or bond yields move a lot, the right starting rate moves with them.
Common Mistakes That Wreck a Withdrawal Plan
Even with the right rate, a few avoidable errors can blow up a solid plan.
Treating the rate as an unbreakable law. It's a starting point, not a contract signed in blood. The retirees who get in trouble withdraw the same inflation-adjusted amount straight through a crash. Even a little flexibility turns a fragile plan into a durable one.
Ignoring inflation. Bengen calls inflation "the greatest enemy of retirees" — worse than a crash, because a bear market recovers but inflation permanently locks in a larger withdrawal. With headline inflation at 4.2% in mid-2026, a plan assuming a tame 2% forever is quietly underfunded.
Forgetting taxes. A traditional-IRA dollar isn't a Roth dollar. A 4% withdrawal from a pre-tax account might be 3.2% after the IRS. Plan in after-tax dollars.
Letting fees eat the rate. A 1% advisory fee comes directly off your safe rate — 4% sustainable minus 1% in fees leaves 3% to live on. Know what you're paying.
Anchoring only on dividends or RMDs. "I'll just live off the dividends" often leaves you under-spending or reaching for risky high-yield holdings. RMDs are a tax rule, not a spending plan. Build around your total return and actual needs, not one income stream.
Frequently Asked Questions
Is the 4% rule still safe in 2026? Mostly, yes — for a traditional 30-year retirement, 4% remains a reasonable, slightly conservative starting point. Morningstar's 2026 figure is a touch lower at 3.9%, while the rule's inventor, Bill Bengen, now argues 4.7% is the safe floor and ~5–5.5% is realistic if you stay flexible. The honest answer: 4% is a fine default, not a law of physics.
How much can I safely withdraw from a $1 million portfolio? At 4%, that's $40,000 in the first year, rising with inflation after that. The 2026 range runs from about $39,000 (Morningstar's 3.9%) to roughly $47,000–$55,000 (Bengen's 4.7%–5.5%) — a $16,000-a-year spread that comes down to your horizon and how flexible you're willing to be.
What is the 25x rule? It's the flip side of the 4% rule: if you can safely withdraw 4%, you need 25 times your annual spending invested (1 ÷ 0.04 = 25). Want a more conservative 3.2% for a long retirement? That's about 31x. A 5% guardrails approach is 20x. Multiply the annual spending you want to cover by the multiplier to get your FIRE number.
What's a safe withdrawal rate for a 50-year early retirement? Lower than the standard 4%. The longer the runway, the more a bad early market can compound against you, so deep-FIRE retirees usually anchor nearer 3.0–3.2% (roughly 31–33x expenses) and lean on flexibility and some part-time income rather than a single fixed rate.
What is sequence-of-returns risk? It's the danger that when your returns happen matters as much as their average. Two retirees can earn the same 7% average over 30 years, but the one who hits a bad market in the first decade — while withdrawing — can run out, while the one who gets the bad years late ends with plenty. It's why early retirees stay cautious in the first few years.
Can I withdraw more than 4%? Yes, if you build in flexibility. Guardrail systems like Guyton-Klinger let you start around 5–5.5% in exchange for a promise: trim spending after bad years, and you can raise it after good ones. The rigid "set 4% and never look again" plan is the one that needs the biggest safety margin.
The Bottom Line: There's No Universal Safe Withdrawal Rate in 2026
Let me bring it home the way I'd say it to a friend. I won't hand you my number, because it's the wrong one for you — but I'll tell you how I'd choose: start from your horizon, be honest about whether you'll actually flex in a bad year, and lean conservative if your runway is long, because I'd rather be the retiree with a slightly fat cushion than the one forced to sell into a crash. And then — this is the half almost nobody does — give yourself real permission to spend once the floor and the flexibility are there.
2026 produced three different "safe withdrawal rate" headlines — Morningstar's 3.9%, Bengen's 4.7%, his flexible 5.5% — because each answers a different question. Morningstar asks what's prudent given today's expensive market? Bengen asks what's the worst that's ever actually happened? Neither is wrong; neither is automatically your answer.
Your safe withdrawal rate in 2026 comes from your horizon, your portfolio, your guaranteed-income floor, and your willingness to flex. A 30-year retiree with a pension and a flexible budget can credibly run 5% with guardrails; a 45-year-old funding a 50-year FIRE retirement should anchor near 3.5%. Pick your baseline from your horizon, then adjust up for flexibility and a guaranteed-income floor, or down for rigidity and a long runway.
And don't lose the twist: for most diligent savers, the bigger danger isn't running out of money — it's the 2.8x unspent pile and the "life not lived." Give yourself permission to spend, especially in the go-go years, if you've got the floor and the flexibility to back it up.
The habit that ties it all together is tracking. You can't run a guardrail-based strategy without knowing your current portfolio value, notice you're underspending without watching the balance, or turn a percentage into next month's paycheck without an up-to-date number. That's exactly what My Financial Freedom Tracker is built for — watching your net worth month over month, so each year you can recompute your rate against what you actually have, set your own paycheck, and see whether to tighten up or finally take the trip. No bank linking required.
Have a question about modeling your own withdrawal rate, sizing your cash bucket, or figuring out your multiplier? Email me at dennis.vymer@myfinancialfreedomtracker.com.
The 4% rule was never a law — it was the unluckiest retiree's floor. Your job in 2026 isn't to obey a single number. It's to find the one that fits your life, and then actually live it.
Stay Updated
Get notified when we publish new articles.
Ready to Apply This?
Start tracking your finances today and put these tips into practice.
- Import bank statements in seconds
- AI-powered categorization
- Beautiful visualizations
- Set and track financial goals
Related posts
 Start Here
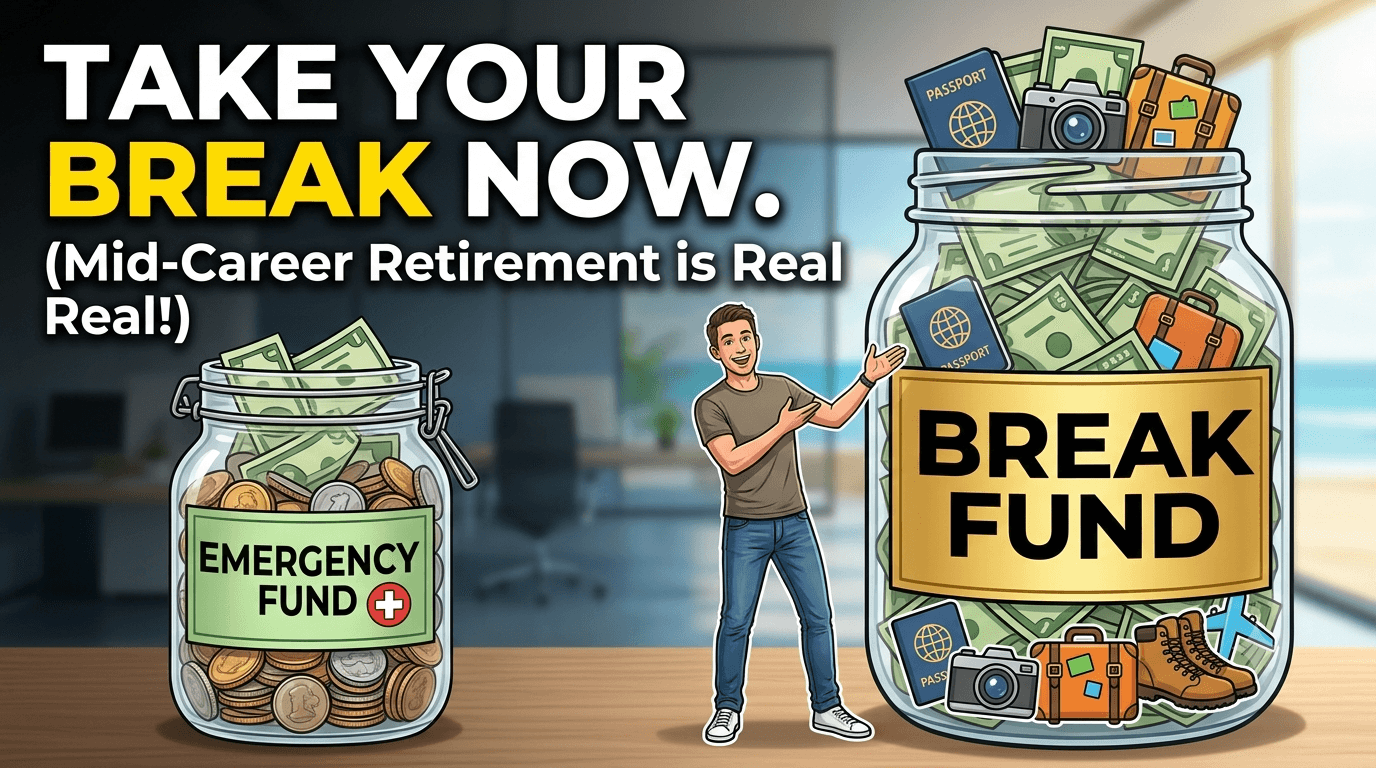
Micro-Retirement Without Wrecking Your FIRE Plan (2026)
A mid-career break can buy back a year of your life without wrecking your FIRE plan — if you fund it right. How to size a break fund and protect your net worth.
 Start Here
Empower vs Monarch Money (2026): Fees, Features, Verdict
Empower is free but sells 0.89%/yr advice once you link $100K. Monarch costs $99.99/yr and budgets better. June 2026 verified pricing, honest verdict.
 Start Here
Net Worth Trackers That Don't Link to Your Bank (2026)
Track net worth without handing over bank logins: spreadsheets, GnuCash, Wealthfolio, Worthy, Kubera, and my manual-first tracker — honestly compared.
 Start Here
YNAB Alternatives That Are Actually Free (2026 Guide)
YNAB costs $109/year in 2026. EveryDollar, Goodbudget, Actual Budget, spreadsheets, and my own tracker — what's actually free, with every catch listed.
 Start Here
Social Security 2033: FIRE-Proof Your Plan for a 23% Cut
The May 2026 CBO update moved insolvency to 2032 — a 23-28% benefit cut by 2033. How FIRE investors recalibrate nest egg, claiming age, and withdrawals.