Private Markets for Retail Investors: I Build Products for a Living, and "Democratized" Means They Ran Out of Institutions.


The line that got me was "now available to individual investors."
Not the returns chart underneath it. Not the word democratized in the headline. Just that one sentence, set in the calm, faintly apologetic font product people use when something has finally been made available to you. Private markets for retail investors, in 2026, is a launch. And writing launches is what I do between nine and five.
So I skipped the copy and went looking for the pipeline. Nobody writes "now available to individual investors" because individual investors got better at anything. You write it when the customer you built the thing for has slowed down and somebody senior has asked what else you can do with the same inventory.
This one nearly had me. Every hype cycle I've been pitched in the last decade arrived dressed as a moonshot, easy to walk past. This one turns up in a suit, talking about diversification, patience and ten-year horizons. It sounds like me. That's precisely the problem, and I only recognise the trick because one lucky stock pick convinced me I could read markets and the crypto cycle sent the invoice.
Here's the whole argument in one line: access to an asset class is not an edge. It's a sales channel, and you are the channel.
What private markets for retail investors actually looked like in 2026
Two continents, one wave, two sets of plumbing.
In Europe, ELTIF assets went from €7.1bn in 2021 to €34bn at the end of 2025, with 113 new funds launched in 2025 against 61 the year before and roughly three quarters of them open to retail. In the US, the semi-liquid and evergreen universe hit $607.2bn across 567 funds by the first quarter of 2026, about double where it sat in 2022. Globally, evergreen launches hit 123 in 2025, a decade high, against 50 in 2020.
The retail share of private credit went from under 1% of assets to 13% over a decade, about $280bn on the Bank for International Settlements' numbers. The first private credit ETF listed in the US in early 2025, holding a private-credit sleeve of 10% to 35%. Nobody would have believed that sentence in 2015.
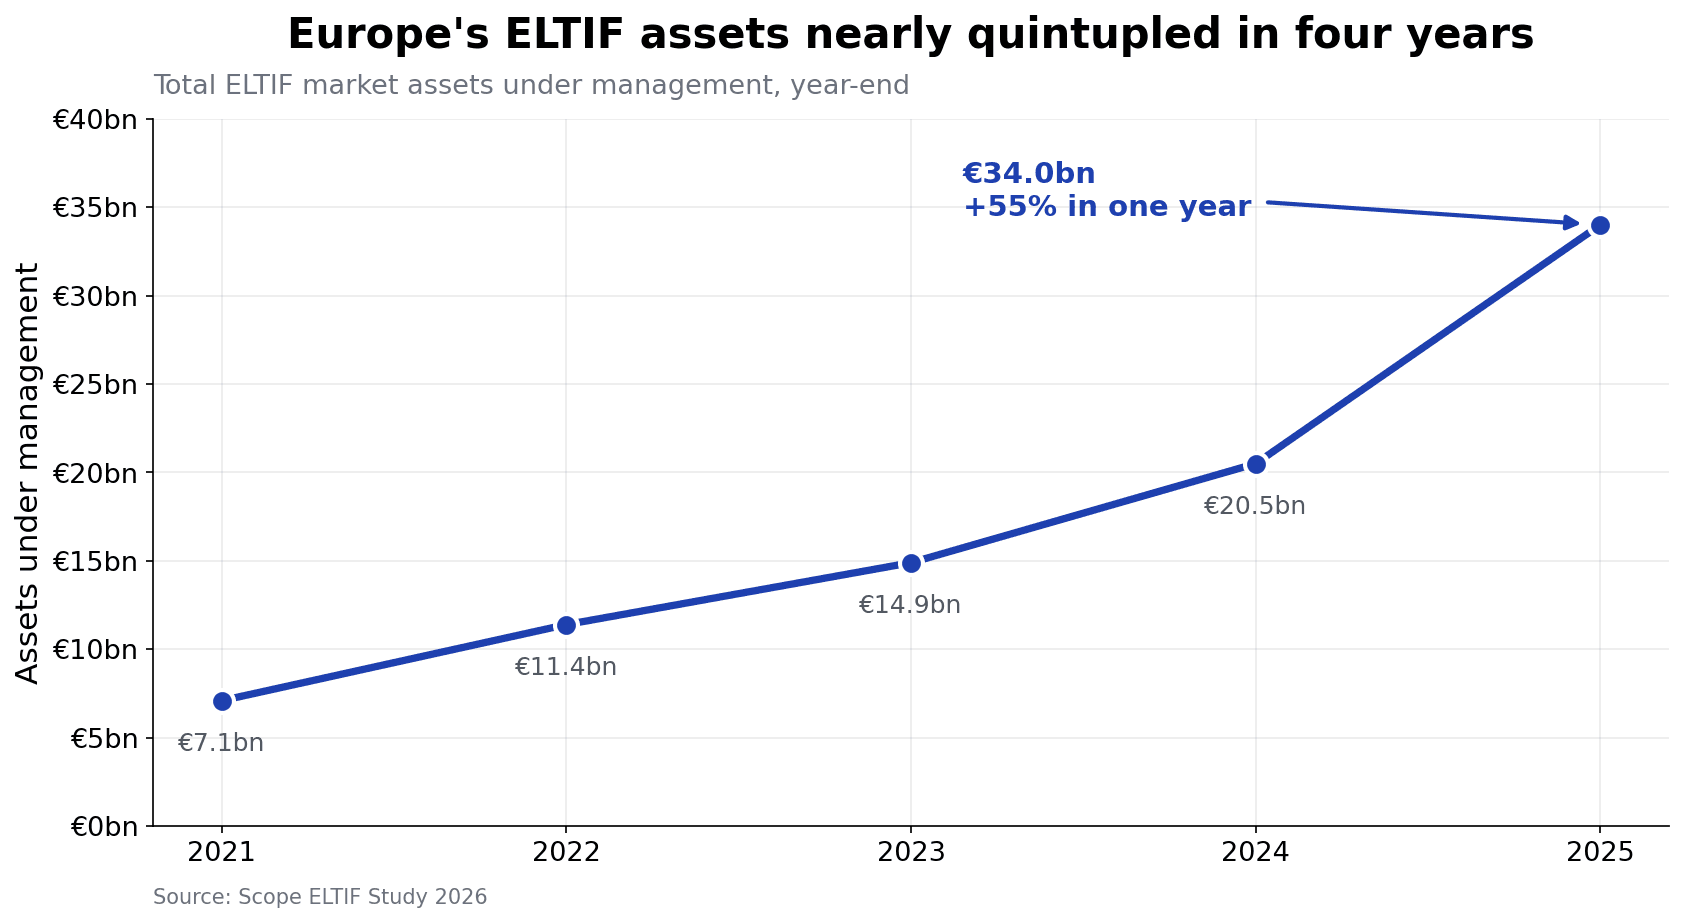
Data: Scope ELTIF studies 2025 and 2026.
I'm not going to explain ELTIF 2.0 or interval funds. None of the arguments that matter depend on which one lands in your account.
Read the launch like a product manager
Now the pipeline.
Global private equity fundraising peaked at $840.9bn in 2023, fell to $664.8bn in 2024, and came in under $600bn in 2025. Money coming back dried up at the same time: 2014-vintage funds had returned 33% of capital five years in, 2019 vintages 22%. Roughly 31,000 unsold portfolio companies sit on about $3.7tn of value, and exits fell from 1,210 in 2021 to 321 in 2025.
Then the tell. Private equity management fees hit a record low for 2024 vintages, 1.74% for buyouts, down from 1.85%. Preqin's own explanation is a "distribution drought," with managers offering first-close discounts and carry-free co-investment to get cheques signed.
Read that as a launch review and the story writes itself. The institutional customer negotiated the price down and slowed the orders. Then the same strategy grew a retail wrapper, a distribution network and a marketing vocabulary it had managed thirty years without. Better Markets says the quiet part without diplomacy: the industry is struggling to raise from pensions and endowments and is aiming at the $12tn in American retirement accounts.
Almost everything written for ordinary investors on this is a features list. Structure, liquidity terms, minimums, evergreen funds explained in nine hundred neutral words. It grades the product and never asks who needed the launch. That's the wrong review. In years of shipping software I have never seen a healthy product go hunting for a harder, smaller, more expensive-to-serve segment. Name me a strategy that opened to small investors because the returns got better and I'll update this article and credit you by name.
The single comparison that settles it for me
Should retail investors buy private credit? The pitch rests on the illiquidity premium: lock your money up, get paid extra for it. That premium is measurable, and somebody measured it.
CFA Institute decomposed direct lending's 994 basis points of gross yield: 200 from the risk-free rate, 519 from duration, 175 from credit spread, and 100 from illiquidity. They put the illiquidity component of the advantage over public credit at 100 to 200 basis points.
Now the price. The Private Equity Stakeholder Project looked at 15 US retail evergreen private equity funds and found a median expense ratio of 3.76% a year, running up to 5.20%, plus sales charges of up to 5.00%. Morningstar puts the average semiliquid fund near 3%. In Europe the ELTIF average management fee is 1.80%, before performance fees of 10% to 25% over a hurdle and entry fees reaching 5% in the mass-affluent segment.
The illiquidity premium is 100 to 200 basis points. The median retail wrapper charges 376 basis points a year before you've paid to walk in the door.
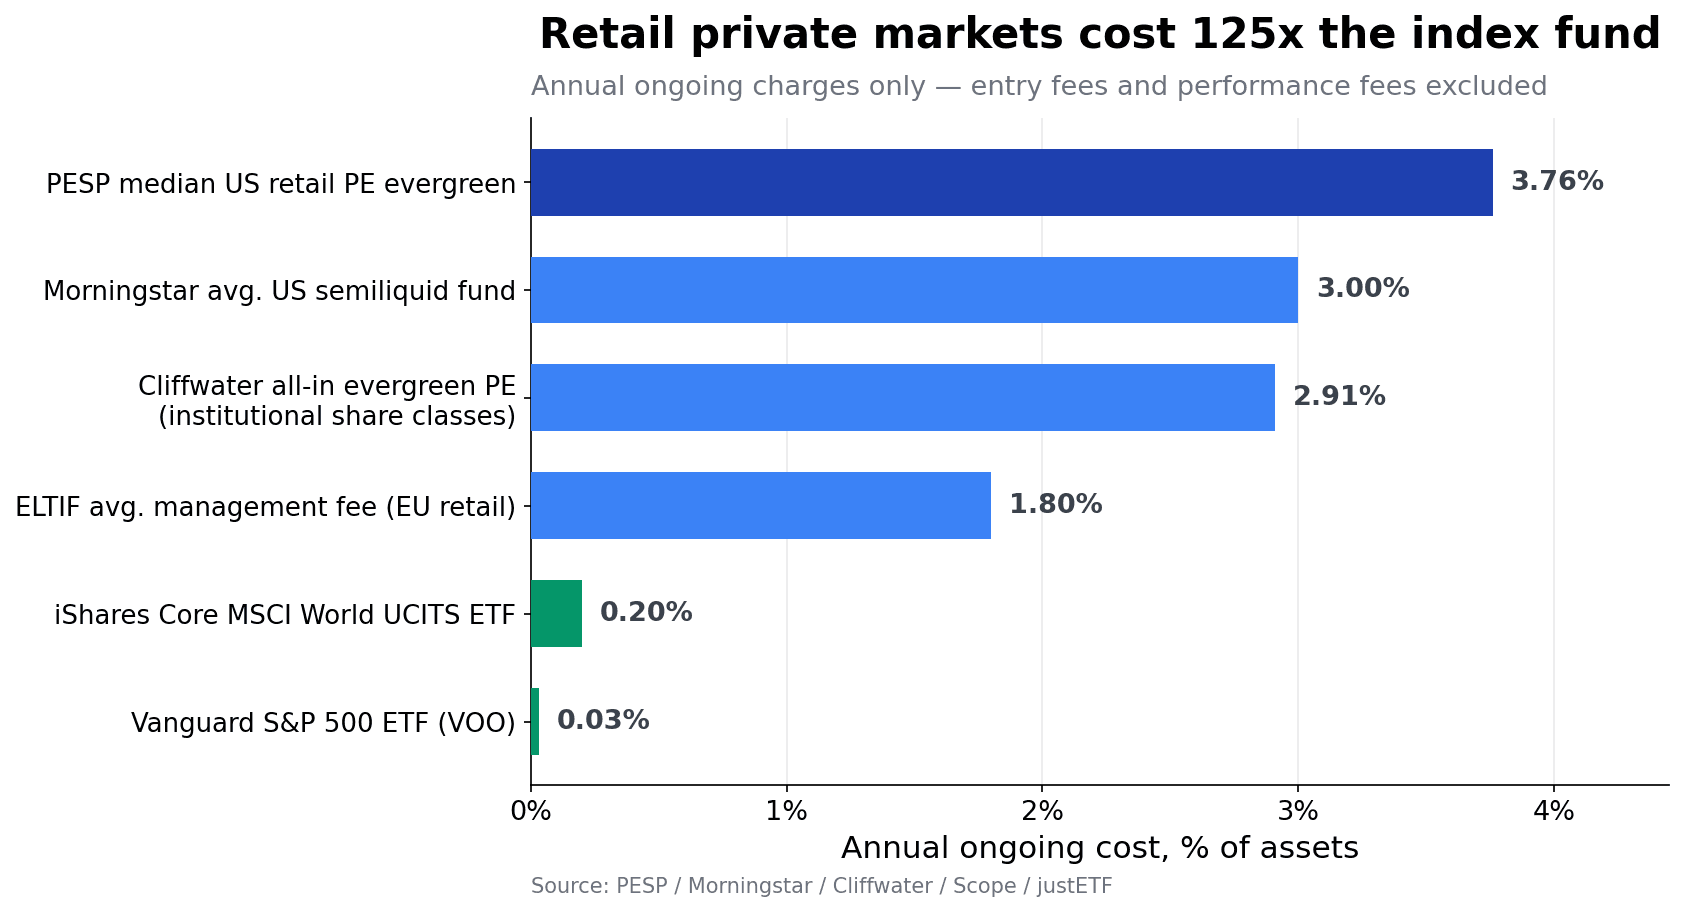
Data: PESP, Morningstar, Cliffwater, Scope and justETF.
The world ETF I actually buy costs 0.20% a year; the US equivalent runs at 0.03%. So a 3.76% product starts every single year about 3.6 points behind the boring option. The documented illiquidity premium covers one to two of those points. The manager has to find the rest, forever, before any of this pays you a cent.
And the number on the tin is not the number. Blue Owl Credit Income's prospectus showed 1.8% on management fees; the realised 2024 all-in cost was 3.2%. Two thirds of unlisted business development companies didn't disclose performance-fee information in their prospectuses at all. I read spec sheets for a living. One that omits the main cost line isn't an oversight, it's a decision somebody made in a meeting.
The gate is not a malfunction. It's the product.
2026 was the year the liquidity promise got tested in public. It did not hold.
In the first quarter, holders of 40.7% of Blue Owl's Technology Income Corp asked to get out. They got the 5% quarterly cap, prorated, $179m approved. The sister fund saw 21.9% ask. Across the two, investors tried to pull about $5.4bn and were handed 5%. The technology fund held over $1.3bn in liquid assets and net leverage of 0.82x, so this was not distress. It worked exactly as written.
Morgan Stanley's $7bn North Haven Private Income Fund got requests for 11.6% of units in the second quarter and filled roughly 43% of them. Ask for €10,000, receive about €4,300 and a wait. In June, Partners Group capped withdrawals on an evergreen fund and moved the whole listed private-markets sector on the announcement. The European bookend to the American story.
Then the number that belongs in every article on this and appears in almost none. In the first quarter of 2026, for the first time on record, investors pulled more out of non-listed BDCs ($6.9bn) than they put in ($4.9bn), with gross sales down 59% year over year. The Bank of England's July report says redemption requests ran high in several retail funds, "with some limiting redemptions, underlining both liquidity mismatch and valuation concerns."
The arithmetic fits in your head. A 5% quarterly cap, 20% of holders heading for the exit, and you receive a quarter of what you asked for.
Morningstar's Bryan Armour said the quiet part in one line: the gating "is to be expected, and it is working as intended."
Set that against who's buying. 52% of American investors say three years or less is their comfortable maximum holding period, against a recommended ten. 24% of US investors and 18% of UK ones say they understand how private markets work, and only 16% of advisors call themselves very familiar with these structures.
I own a second house. I know what illiquid feels like on the day you'd rather have the money, and nobody charged me 3.76% to teach me.
The smoothed NAV is the part that actually scares me, and I build the dashboard
This is the bit almost nothing written for individuals covers, and the one with my fingerprints on it.
The Cliffwater Direct Lending Index reports a 9.04% annualised return with 2.60% volatility. That's a Sharpe ratio of 2.71 against public high yield's 0.41, the kind of number that makes a sensible person's eyebrows go up. CFA Institute, not a hostile witness, explains it themselves: returns are "calculated quarterly from appraised NAVs rather than daily market transactions," and that method "inherently smooths returns and compresses measured volatility."
Look at 2022 if you want it concrete. High-yield bonds fell 11.19%, investment grade fell 13.01%, and the direct lending index printed +6.29%. Same economy, same borrowers, different marking convention.
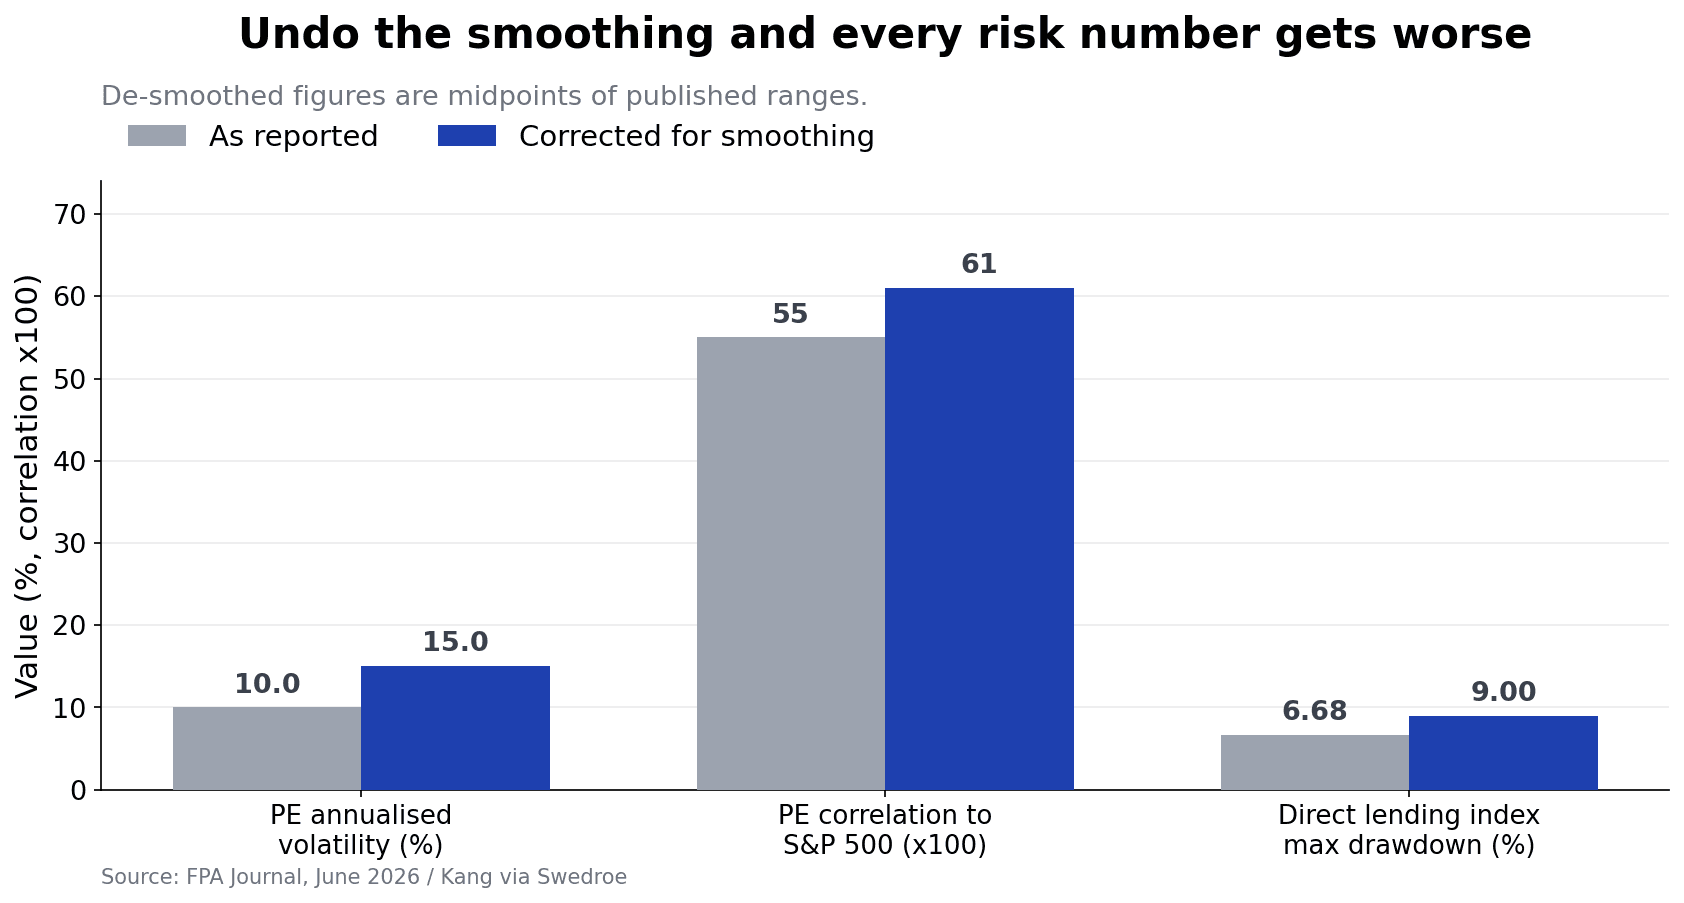
Data: FPA Journal, June 2026, and Kang via Swedroe.
The FPA Journal ran the de-smoothing in June. These are estimates with error bars rather than corrected truths, so take them as ranges. A representative private equity aggregate reporting 10% volatility lands somewhere between 13.6% and 17.3%, call it 15% at the midpoint. Its correlation to the S&P 500 goes from a reported 0.55 to somewhere in 0.58 to 0.64. Sharpe ratios computed on the reported numbers overstate the adjusted version by roughly half. Cliff Asness has a name for this and it isn't flattering: volatility laundering.
Here's why I take it personally. I build a net-worth tracker, and the whole point of it is that the line tells you the truth about what you own. Drop a quarterly-appraised holding in and the line gets calmer. A calmer line is not lower risk. It's unmeasured risk, sitting next to a world ETF that gets marked honestly every day and therefore looks like the unreliable one by comparison. I'd be shipping a flattering lie in a nice font.
And the appraised number isn't a price. In the first half of 2025, institutional buyers of private-market portfolios paid an average of 90% of stated NAV. Venture portfolios cleared at 78%, real estate at 71%. Those are professionals buying professional portfolios, not panicked retail sellers. If the people writing the cheques discount the NAV, the NAV in your dashboard is an opinion.
IOSCO's June 2026 report lists seven valuation conflicts and one of them is undervaluation to manage volatility. A global standard-setter has formally written down "making the line look calm" as a thing to watch for. If you've never checked what's actually inside what you own, start there, and yes, that's my product, weigh it accordingly.
The case for private markets for retail investors, made properly
I'd rather make this argument than have it made at me in the comments, and one part of it is genuinely hard.
Evergreen structures are real engineering. A traditional drawdown fund takes about four years to deploy and averages only 0.47x of committed capital actually invested across its life. You either sit on the uncommitted balance in cash and eat the drag, or you over-commit and eat the risk. An evergreen fund is near-fully invested from day one outside a 10% to 20% liquidity sleeve. Morgan Stanley's illustration: at a 12% CAGR the evergreen compounds to 3.7x where a 12% IRR drawdown fund returns 1.74x. No capital calls, no J-curve.
That is better product design, and I'm not going to pretend otherwise because it's inconvenient. It is also orthogonal to my objection. The engineering fixed deployment. It didn't touch the cost, the marking, or what happens when everyone reaches for the door at once. The liquidity sleeve that removed cash drag at your end reintroduced it inside the fund, and MSCI's data shows an 18.1 point spread between the 95th and the 5th percentile evergreen PE fund over twelve months. Manager selection risk didn't vanish. It moved.
Larry Swedroe, the reference skeptic for index investors, defends this asset class. The direct lending index returned 9.5% over 21 years to 2025, beating high yield by 2.9 points, with credit losses averaging 1.01% against 1.49%. Its 2008 drawdown was about 8% while equities fell 46%, and it recovered within four quarters. His verdict: legitimate, tested and reasonably transparent for anyone who genuinely accepts illiquidity. He also publishes the un-smoothing work showing that same index's maximum drawdown going from 6.68% to 9.00% and its Sharpe from 1.39 to 1.03. Both are true at once, and anyone quoting only one is selling you something.
The strongest objection is my own portfolio. One asset class, one fund, a large US weight, companies that already listed. Someone can fairly say I optimised for simplicity and rebranded it as discipline, and I've argued the 100% stocks question elsewhere rather than dodge it. It's a fair hit. My answer is that the thing on offer doesn't fix it. Bolting on a 3.76%-cost, quarterly-marked, gated sleeve of the same corporate credit and equity risk isn't diversification. It's the same economy filmed with a slower camera and a bigger invoice.
About that shrinking public market. It's American.
The best argument the industry has is the honest one: there are fewer listed companies than there used to be. US listed domestic companies went from 8,090 in 1996 to 3,908 in 2025. That's a halving, it's from the World Bank, and it isn't marketing.
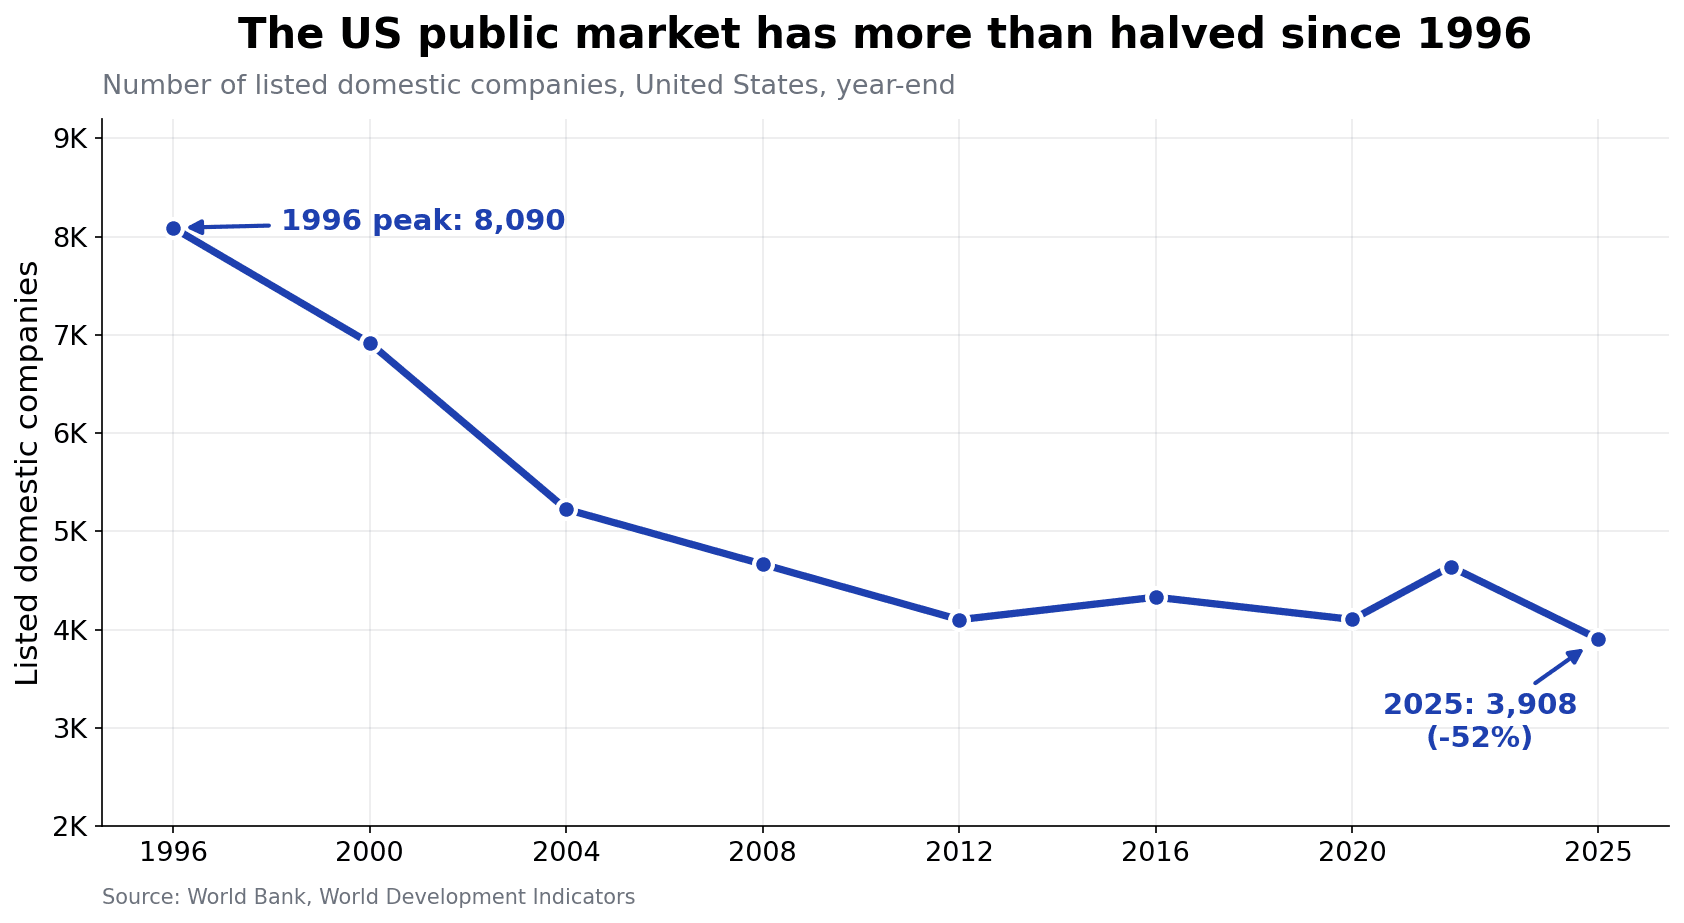
Data: World Bank, World Development Indicators.
Three things about it. The first matters most if you read this from my side of the ocean.
It's a US fact being sold as a universal one. The ECB studied exactly this and found EU and US listed-company counts broadly comparable before 2019, and that it was American listings that surged afterwards, to the point that by 2022 US-listed companies outnumbered those on the four major European exchanges. Europe has its own listing problem, a slower one: Euronext delistings averaged 4.8% of market cap a year from 2019 to 2022 while IPOs raised 0.17%. Different shape, different cause, and no European investor should be handed an American chart as the reason to buy a European product.
Second, the universe shrank in count, not in coverage of economic value. What vanished was mostly micro-caps that were never a meaningful weight in a cap-weighted index.
Third, and this one amuses me: Blackstone, KKR, Apollo, Partners Group and EQT all sit inside a world ETF. If the private economy really is where the value went, you already own the toll booth.
Four questions before anything new gets into the portfolio
The portable part. It works at any portfolio size, in any currency, under any regulator.
- Can I explain how it makes money in two sentences? If the explanation needs a diagram, I don't understand it well enough to hold it through a bad decade.
- What does it cost all-in against the boring alternative? Not the headline. Every line: management, performance fee and its hurdle, acquired fund fees, fund-level borrowing, entry charges. Subtract the stack from a plausible gross number and look at what's left for you.
- Can I sell it on the worst Tuesday of the decade? Not "is there a quarterly window." Can I have my money on the specific day everyone else wants theirs, which is the only day the question ever gets asked.
- Does owning it create a recurring decision? The one people skip, and it's why I stay away from leveraged ETFs even though the maths can be made to work. A holding that makes you decide something every quarter is a permanent tax on your attention, and attention is the input I'm shortest of.
A world ETF passes all four. A semi-liquid private vehicle fails the third outright, because the gate is the product, and fails the fourth forever.
What I'm doing this month
The same thing as last month. One accumulating world ETF, bought automatically, whether or not I have a view that week.
My claim is narrower than the title suggests. I'm not predicting that private credit blows up. It may well be fine, and for an institution with a thirty-year horizon, negotiated fees and no need for the money, it's a perfectly reasonable holding.
The narrow claim: private markets for retail investors are not an upgrade to a plan that already works, the wrapper costs more than the premium it's selling, and "I was finally allowed in" is the worst reason anybody has ever bought anything. When a door opens after thirty years of being shut, the useful question isn't what changed about you.
My daughter is three months old. By the time she's old enough to ask what I do on Wednesdays, I'd like the honest answer to be "not much," and a few years after that, "I teach maths, badly at first." Nothing in that plan is waiting on an asset class I can't sell on a Tuesday.
Stay Updated
Get notified about new articles and MFFT build-in-public updates.
Ready to Apply This?
Start tracking your finances today and put these tips into practice.
- Import bank statements in seconds
- AI-powered categorization
- Beautiful visualizations
- Set and track financial goals
Related posts
 Invest Smart
Is Your House Part of Your Asset Allocation? I Call Myself a 100% Stock Investor and Own Two Houses
I hold 100% stocks, have never owned a bond, and own two houses I had never once put on the same page as the portfolio. The euro-area main residence is 47% of household assets. Here is what the real mix says, why it argues for more equities and not fewer, and the paper that says I am wrong.
 Invest Smart
Holding Leveraged ETFs Long Term Isn't a Maths Problem. It's a You Problem.
At twenty I put everything into one stock and it worked, which is the worst possible outcome. If a 2x version had been one tap away, I'd have tapped it. The maths of leveraged ETFs is arguable. The behaviour isn't. They don't double your returns, they double you.
 Invest Smart
Investing as a Couple With Different Risk Tolerance: My Wife Never Chose 100% Stocks, and Half of It Is Hers
I hold 100% stocks, I decided that years ago, and half that account is my wife's money. She never picked it. A 2026 paper says household portfolios weight the husband's risk preference 0.6 to the wife's 0.4, and being the one who runs the money buys extra weight on top of that.
 Invest Smart
Currency Risk in a World ETF: The Bet I Never Placed and Still Own
I have bought the same world ETF on the same day every month for years and never had an opinion about the three currencies passing through that transfer. It is 72.85% dollars. Here is what I found when I checked, and why I am still not hedging it.
 Invest Smart
I Bonds vs TIPS in 2026: The Hedge I Almost Bought Twice
In 2022 I almost broke my autoinvest to chase a 9.62% I Bond. I ran the real 2026 numbers on I Bonds vs TIPS, and my answer still isn't 'buy either.'