What to Do When Markets Crash (And Why Not to Sell)
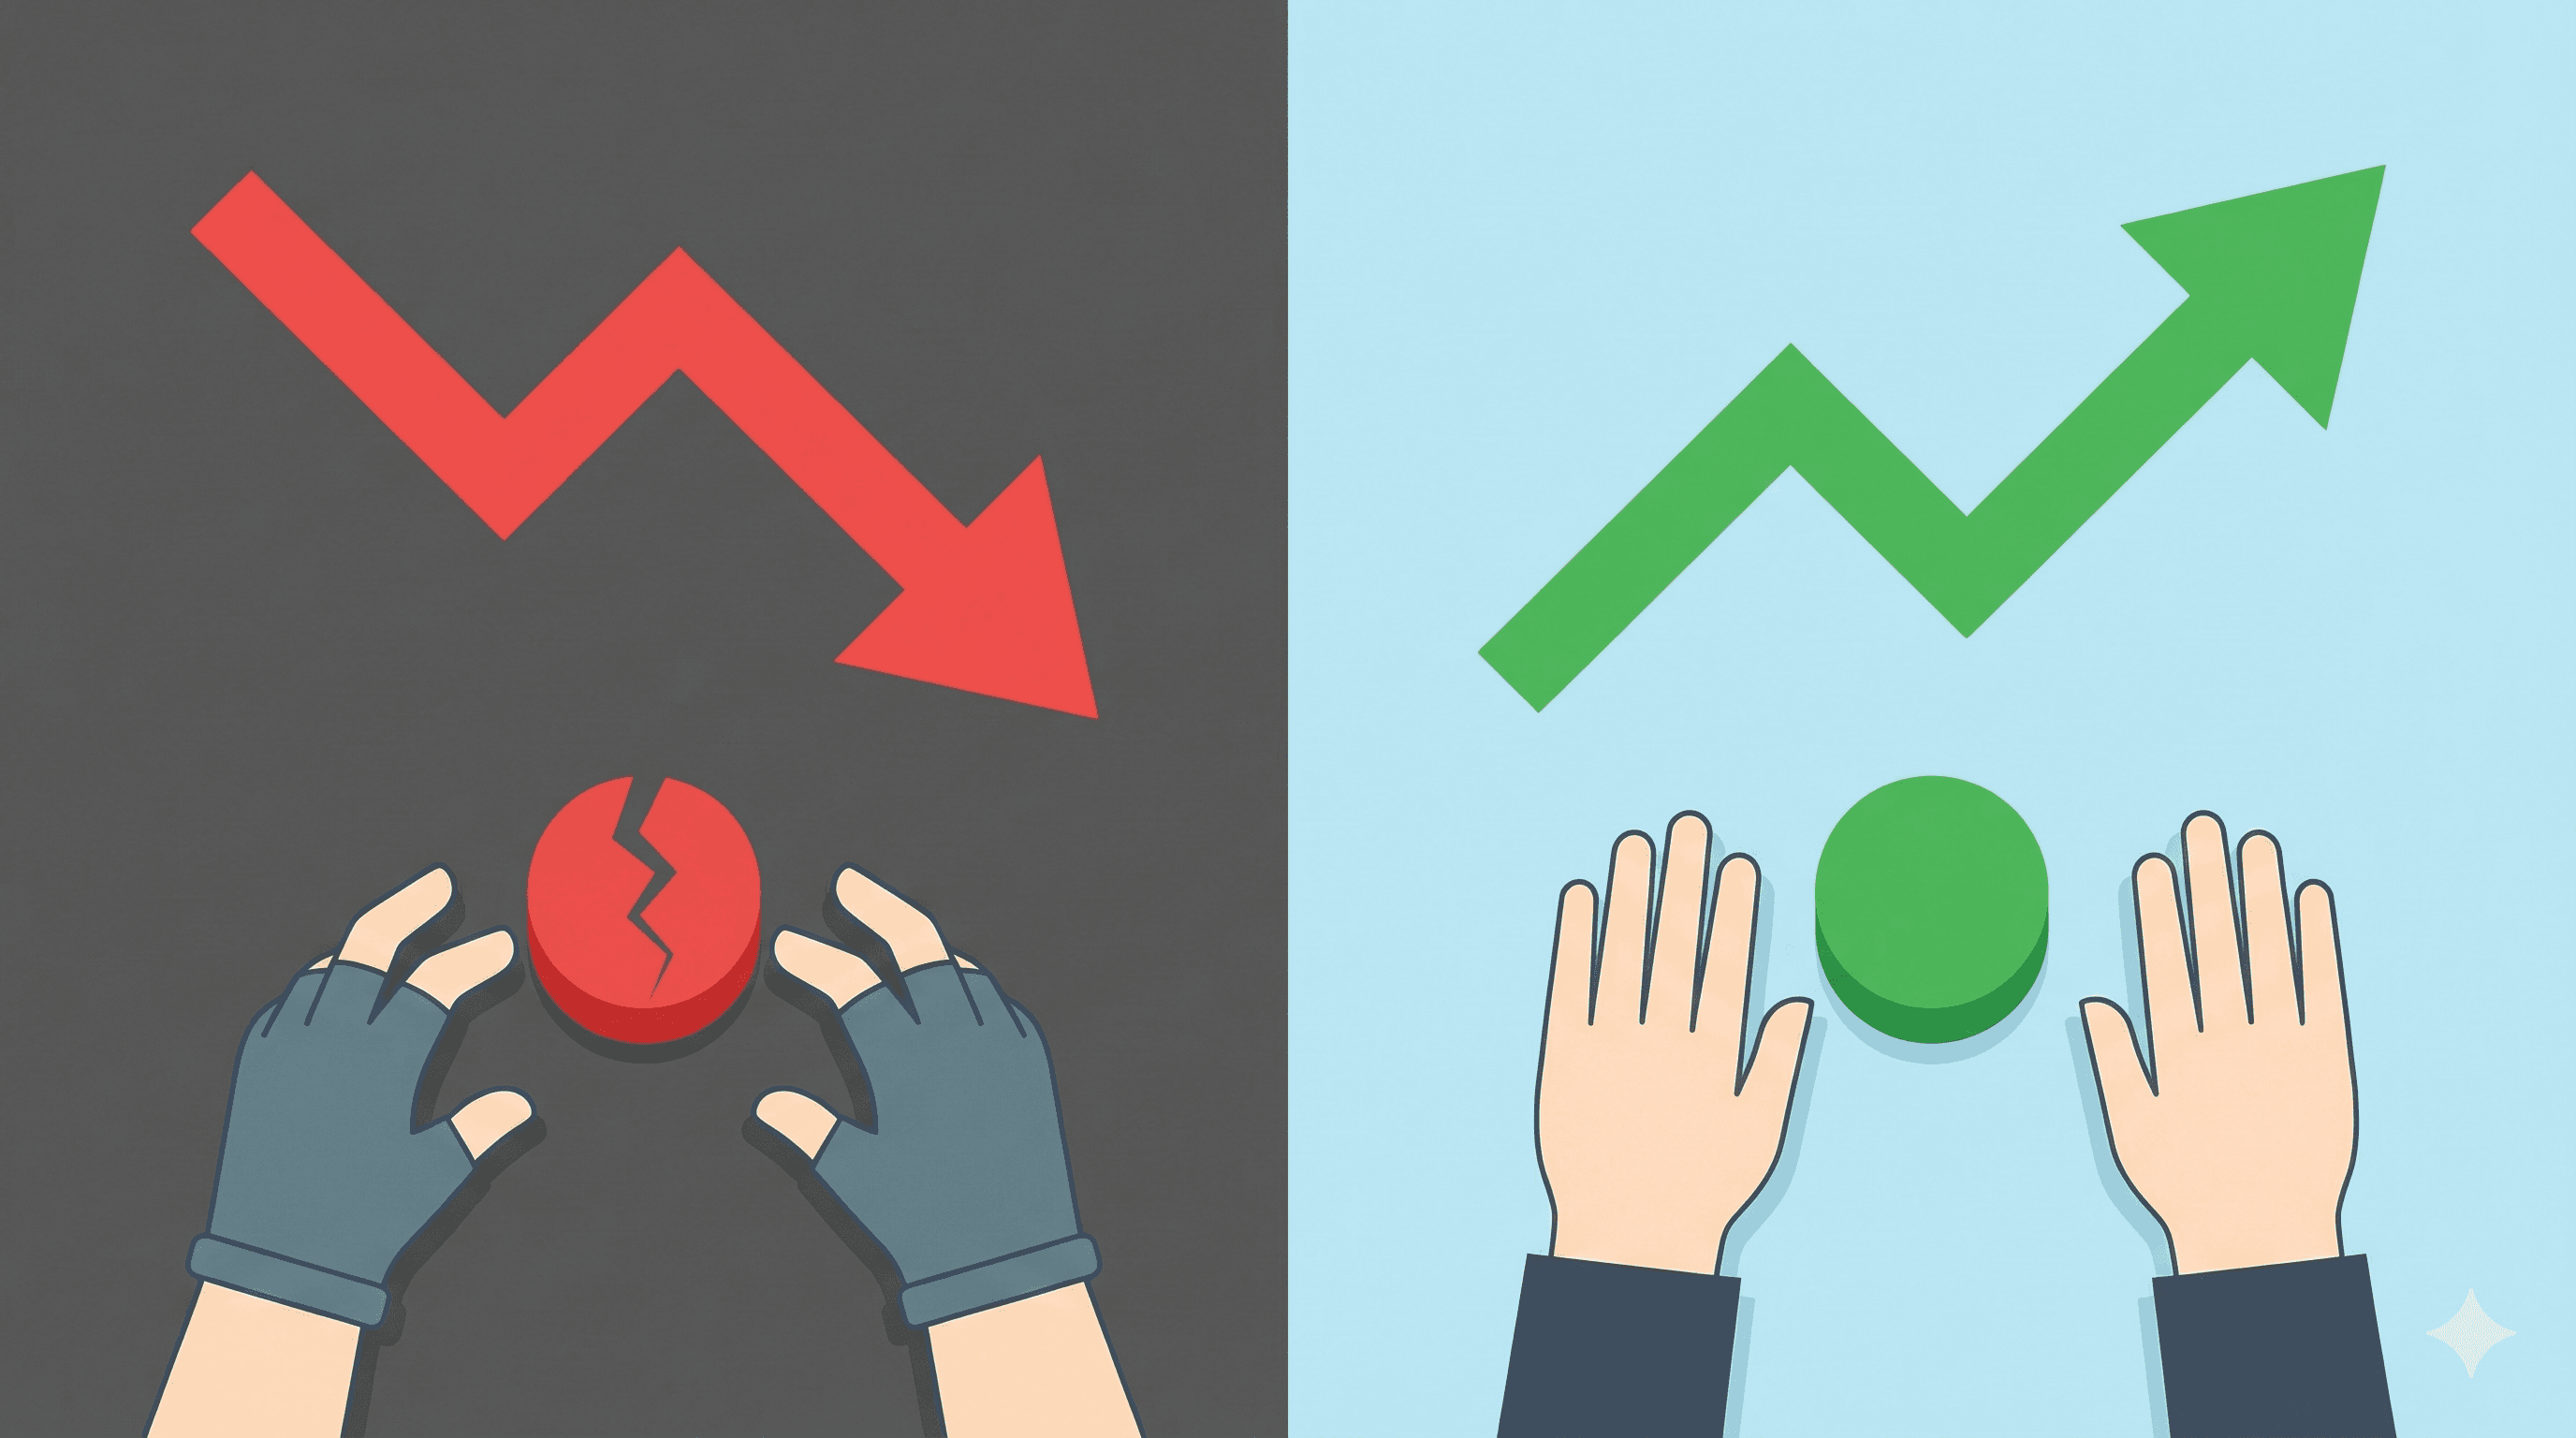
You open your app, check your investments, and see -20%. Your heart skips a beat. Your mind races:
"I need to sell before I lose everything."
Stop. This is exactly the moment when most people make the biggest financial mistake of their lives.
What Does It Mean When "Markets Crash"?
When we say the "market is crashing," we mean that stock and fund prices are falling. Investors categorize these drops by size:
| Name | Drop | What It Means |
|---|---|---|
| Dip | up to -10% | Normal, happens several times a year |
| Correction | -10% to -20% | Uncomfortable but normal |
| Bear market | -20% or more | Bigger drop, can last months |
| Crash | -30% or more, rapidly | Panic, news about the end of the world |
These labels follow the standard definitions: a decline of about 10% to 20% is a correction, and a drop of 20% or more is a bear market (Market trend, Wikipedia).
The important thing to understand:
All of these situations are a normal part of investing. They've always happened and always will.
How Often Do Markets Actually Fall?
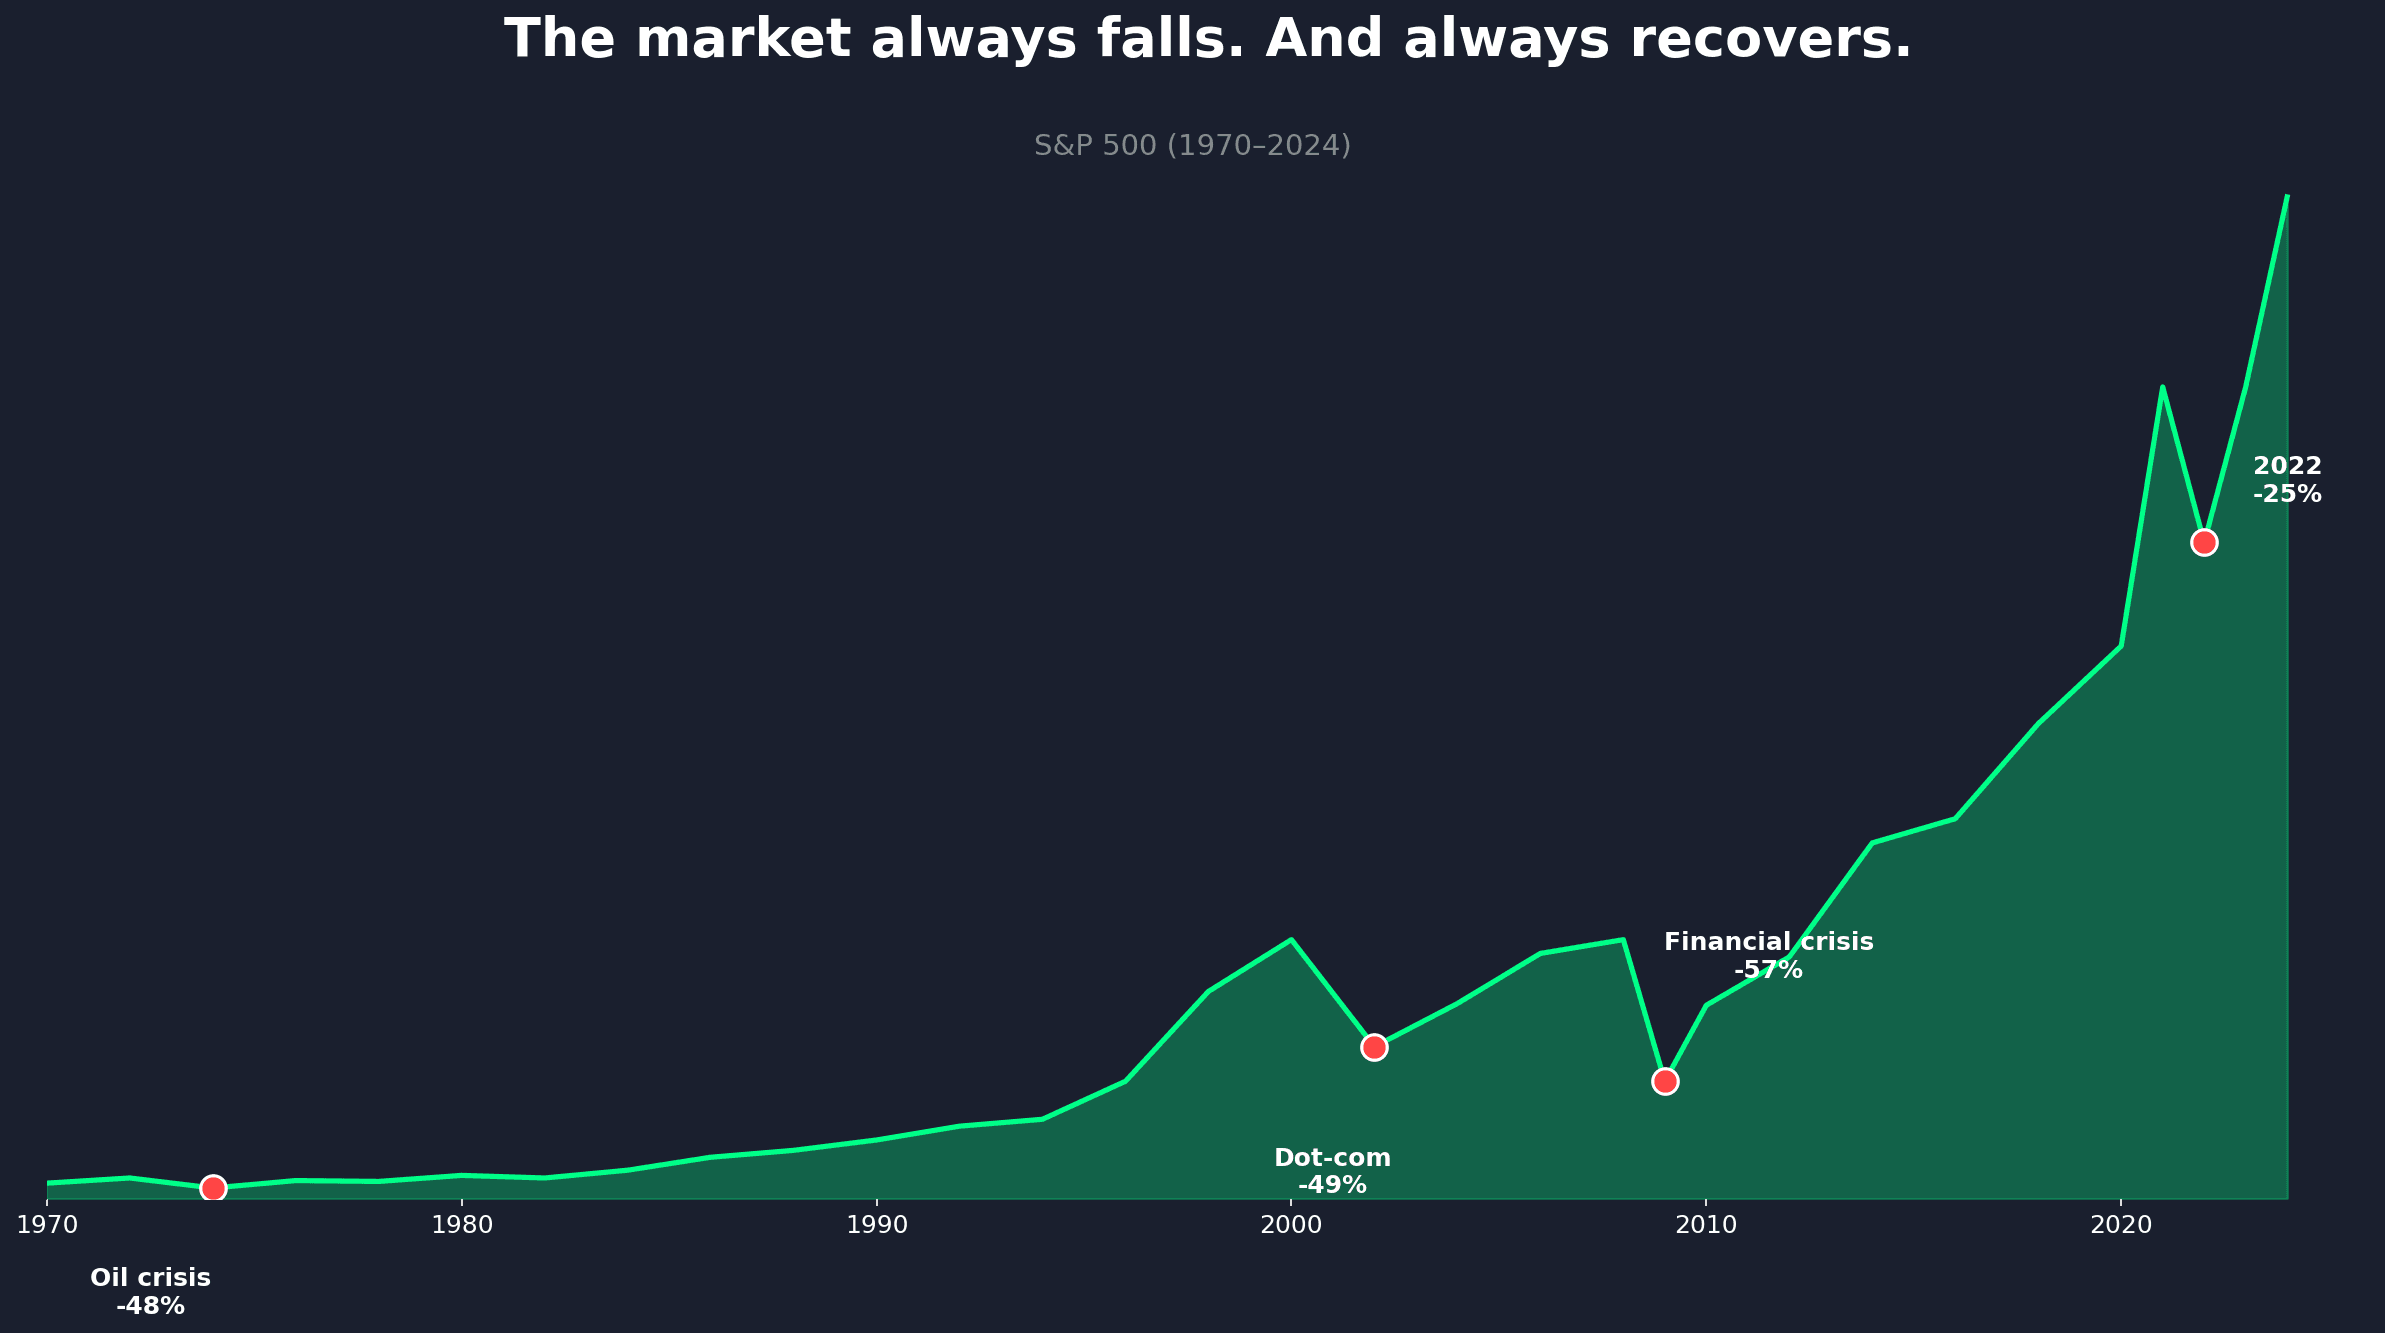
Look at that chart. Over the past 50 years, the S&P 500 has repeatedly fallen deep into bear-market territory — dropping by roughly 40% or more in the 1973–74 slump, the 2000–02 dot-com bust, and the 2007–09 financial crisis (S&P 500 drawdown history, DQYDJ), and about 34% in the 2020 COVID crash (Wikipedia). And every single time, it recovered and went on to make new highs.
Drops aren't exceptions. They're a normal part of the game.
When you see -20% on your account, remember this image. The red dot is uncomfortable — but the green line always continues upward.
If one chart isn't enough, our macro graphs let you pull up decades of inflation, rates and market data yourself and see how often "this time is different" turned out not to be.
Why We Feel the Urge to Sell
Our Brain Doesn't Help
Evolution programmed us for survival. When you see danger, your brain triggers the "run!" response.
The problem? Your brain doesn't distinguish between a tiger and a red number in an app. It sees -25% and screams: "Save yourself! Sell!"
Losses Hurt More
Psychologists found that losing $1,000 hurts roughly twice as much as gaining $1,000 feels good. This is called loss aversion — a well-documented finding in behavioral economics, where losses are felt about twice as strongly as equivalent gains (Loss aversion, overview of the research). We simply hate losing.
That's why when the market drops 20%, you feel it much more intensely than when it rises 20%. And that's why you have such a strong urge to "stop the pain."
What Happens When You Sell
An illustrative example: John and Mike
The numbers below are a simplified illustration, but the market moves behind them are real. Both John and Mike invested $10,000 in an S&P 500 fund in January 2020. In March, COVID hit and the market fell about 34% from its February peak. Both were down roughly $3,400 on paper.
John panicked and sold near the bottom, locking in the loss and sitting in cash. Mike also didn't feel great, but he did nothing.
End of 2020? The S&P 500 actually finished the year up about 18% (total return with dividends reinvested — 2020 S&P 500 return, DQYDJ). So Mike, who held on, ended around $11,800, while John, who sold at the low and stayed out, was still stuck near $6,600.
Same investment, same drop — but a roughly $5,200 gap, created by a single decision.
That gap isn't just a thought experiment. Morningstar measures it across the whole market every year, and the average fund investor earned 8.7% a year while their funds earned 9.9% — John's decision, repeated across millions of accounts.
Why Such a Big Difference?
As long as you don't sell, you haven't lost anything. That -$3,400 is just a number on the screen — it's called a paper loss. You still own the same number of shares.
The moment you sell, the paper loss becomes a real loss. The money is gone and won't come back.
Warren Buffett made exactly this point at the depths of the 2008 crash. Writing in The New York Times, he explained why he was buying while everyone else was selling, summing up his rule in one line:
"Be fearful when others are greedy, and be greedy when others are fearful."
— Warren Buffett, "Buy American. I Am.", The New York Times, October 2008 (full op-ed text)
What TO DO When Markets Crash
1. Nothing (Seriously)
The best strategy is often to do absolutely nothing.
If you have automatic investing set up, let it run. You're actually buying cheaper now.
2. Close the App
The less you look, the better you sleep. In turbulent times, I recommend checking your portfolio at most once a month.
3. Remember Your Plan
Are you investing for retirement 30 years away? Saving for a house in 10 years?
None of that has changed just because the market dropped this month. Your horizon is years, not days.
4. Maybe Buy More
When something goes on sale and you believe in it long-term, it's an opportunity.
Imagine an iPhone priced at $1,000. Suddenly there's a 30% discount. Do you say "great, I'll buy" or "something's wrong, I'll wait until it gets more expensive"?
With stocks, people do the second thing. Which doesn't make sense.
Conclusion
Crashes are scary. But here's the truth:
The investor's biggest enemy isn't the market crash. It's their own panic.
People who profit long-term aren't the smartest ones. They're the ones who can sit and do nothing while everyone around them is panicking.
When you see red numbers, remember:
- As long as you don't sell, you haven't lost anything
- Markets have always recovered
- Your horizon is years, not days
Then close the app and go live your life.
Have questions? Reach out at dennis.vymer@myfinancialfreedomtracker.com.
Stay Updated
Get notified about new articles and MFFT build-in-public updates.
Ready to Apply This?
Start tracking your finances today and put these tips into practice.
- Import bank statements in seconds
- AI-powered categorization
- Beautiful visualizations
- Set and track financial goals
Related posts
 Learn To Invest
Increase Monthly Investment Every Year. I Didn't, and That Was a Pay Cut I Gave Myself.
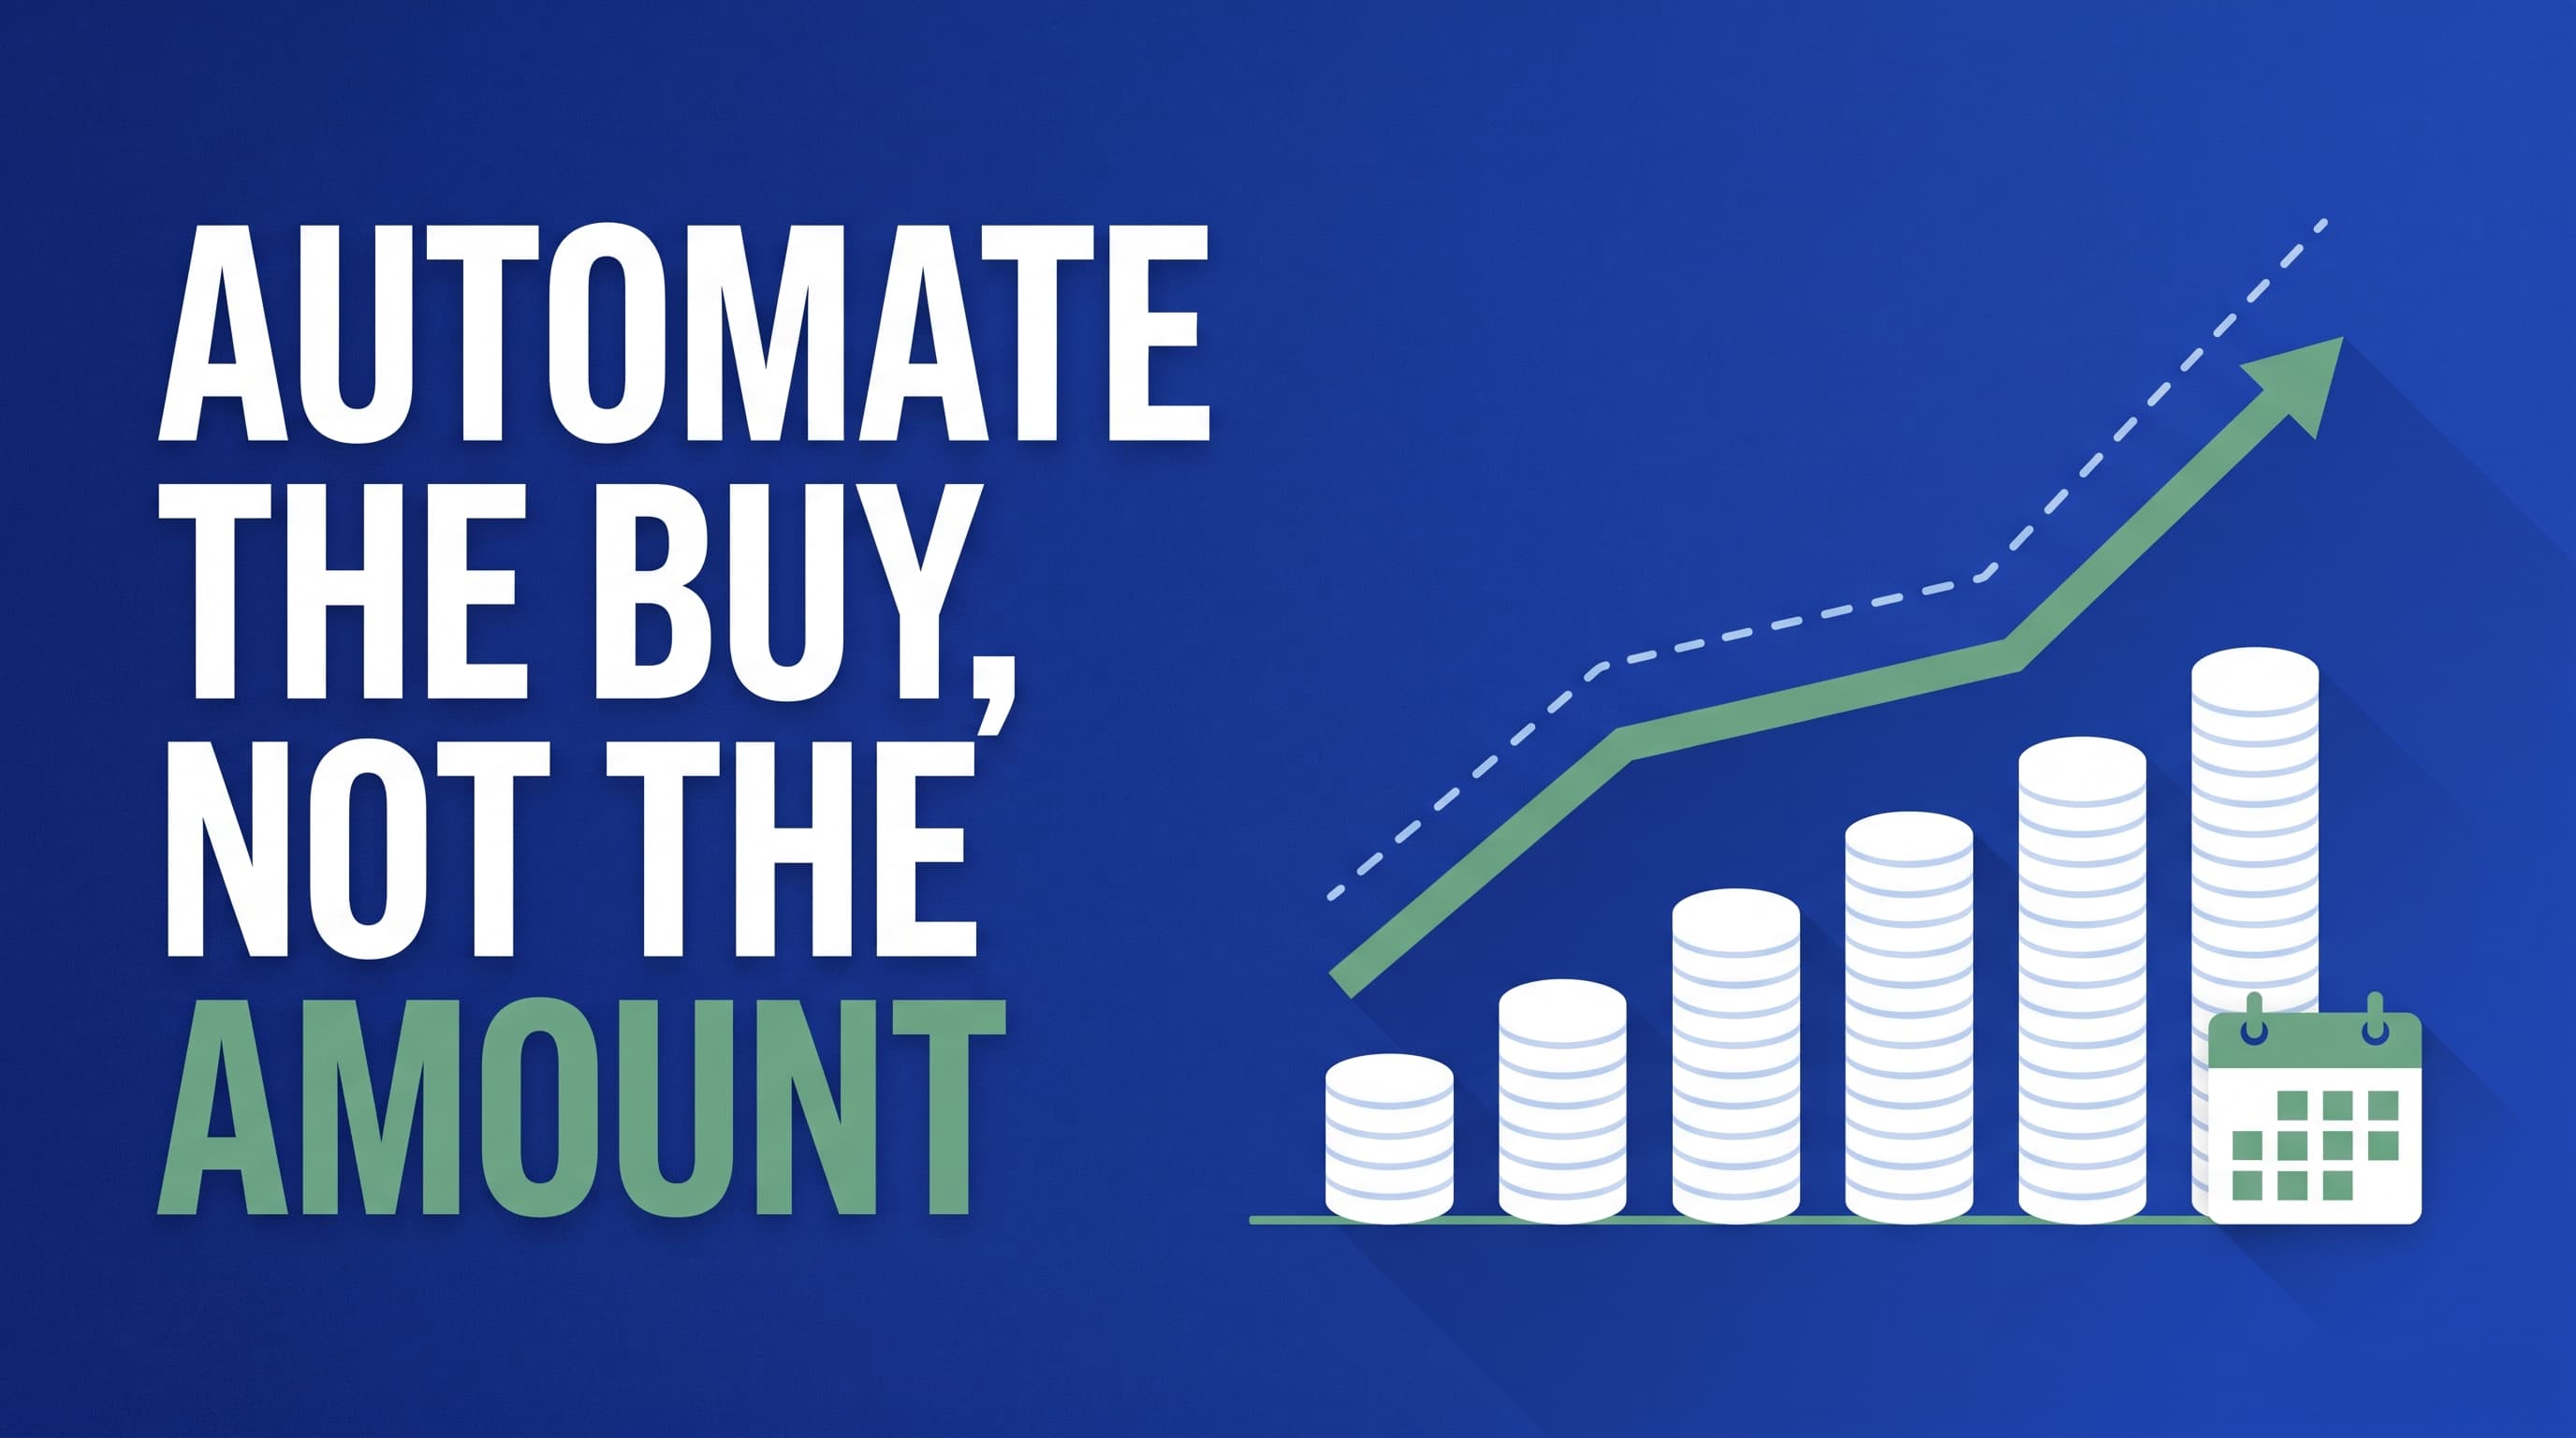
A month ago I called my unchanged monthly ETF transfer a sign of discipline. It is a pay cut. A contribution frozen since 2020 buys about 22% less, and a 10% savings rate drifts to under 8% with nobody deciding anything. Automate the buy. Never automate the amount.
 Learn To Invest
Investing App Gamification: Check What Your Broker Earns
The confetti isn't the problem, the revenue model is. A ten-minute test of what your broker earns while you do nothing, and why Europe and the US differ.
 Learn To Invest
When to Sell Index Funds: Four Tests Before You Touch Them
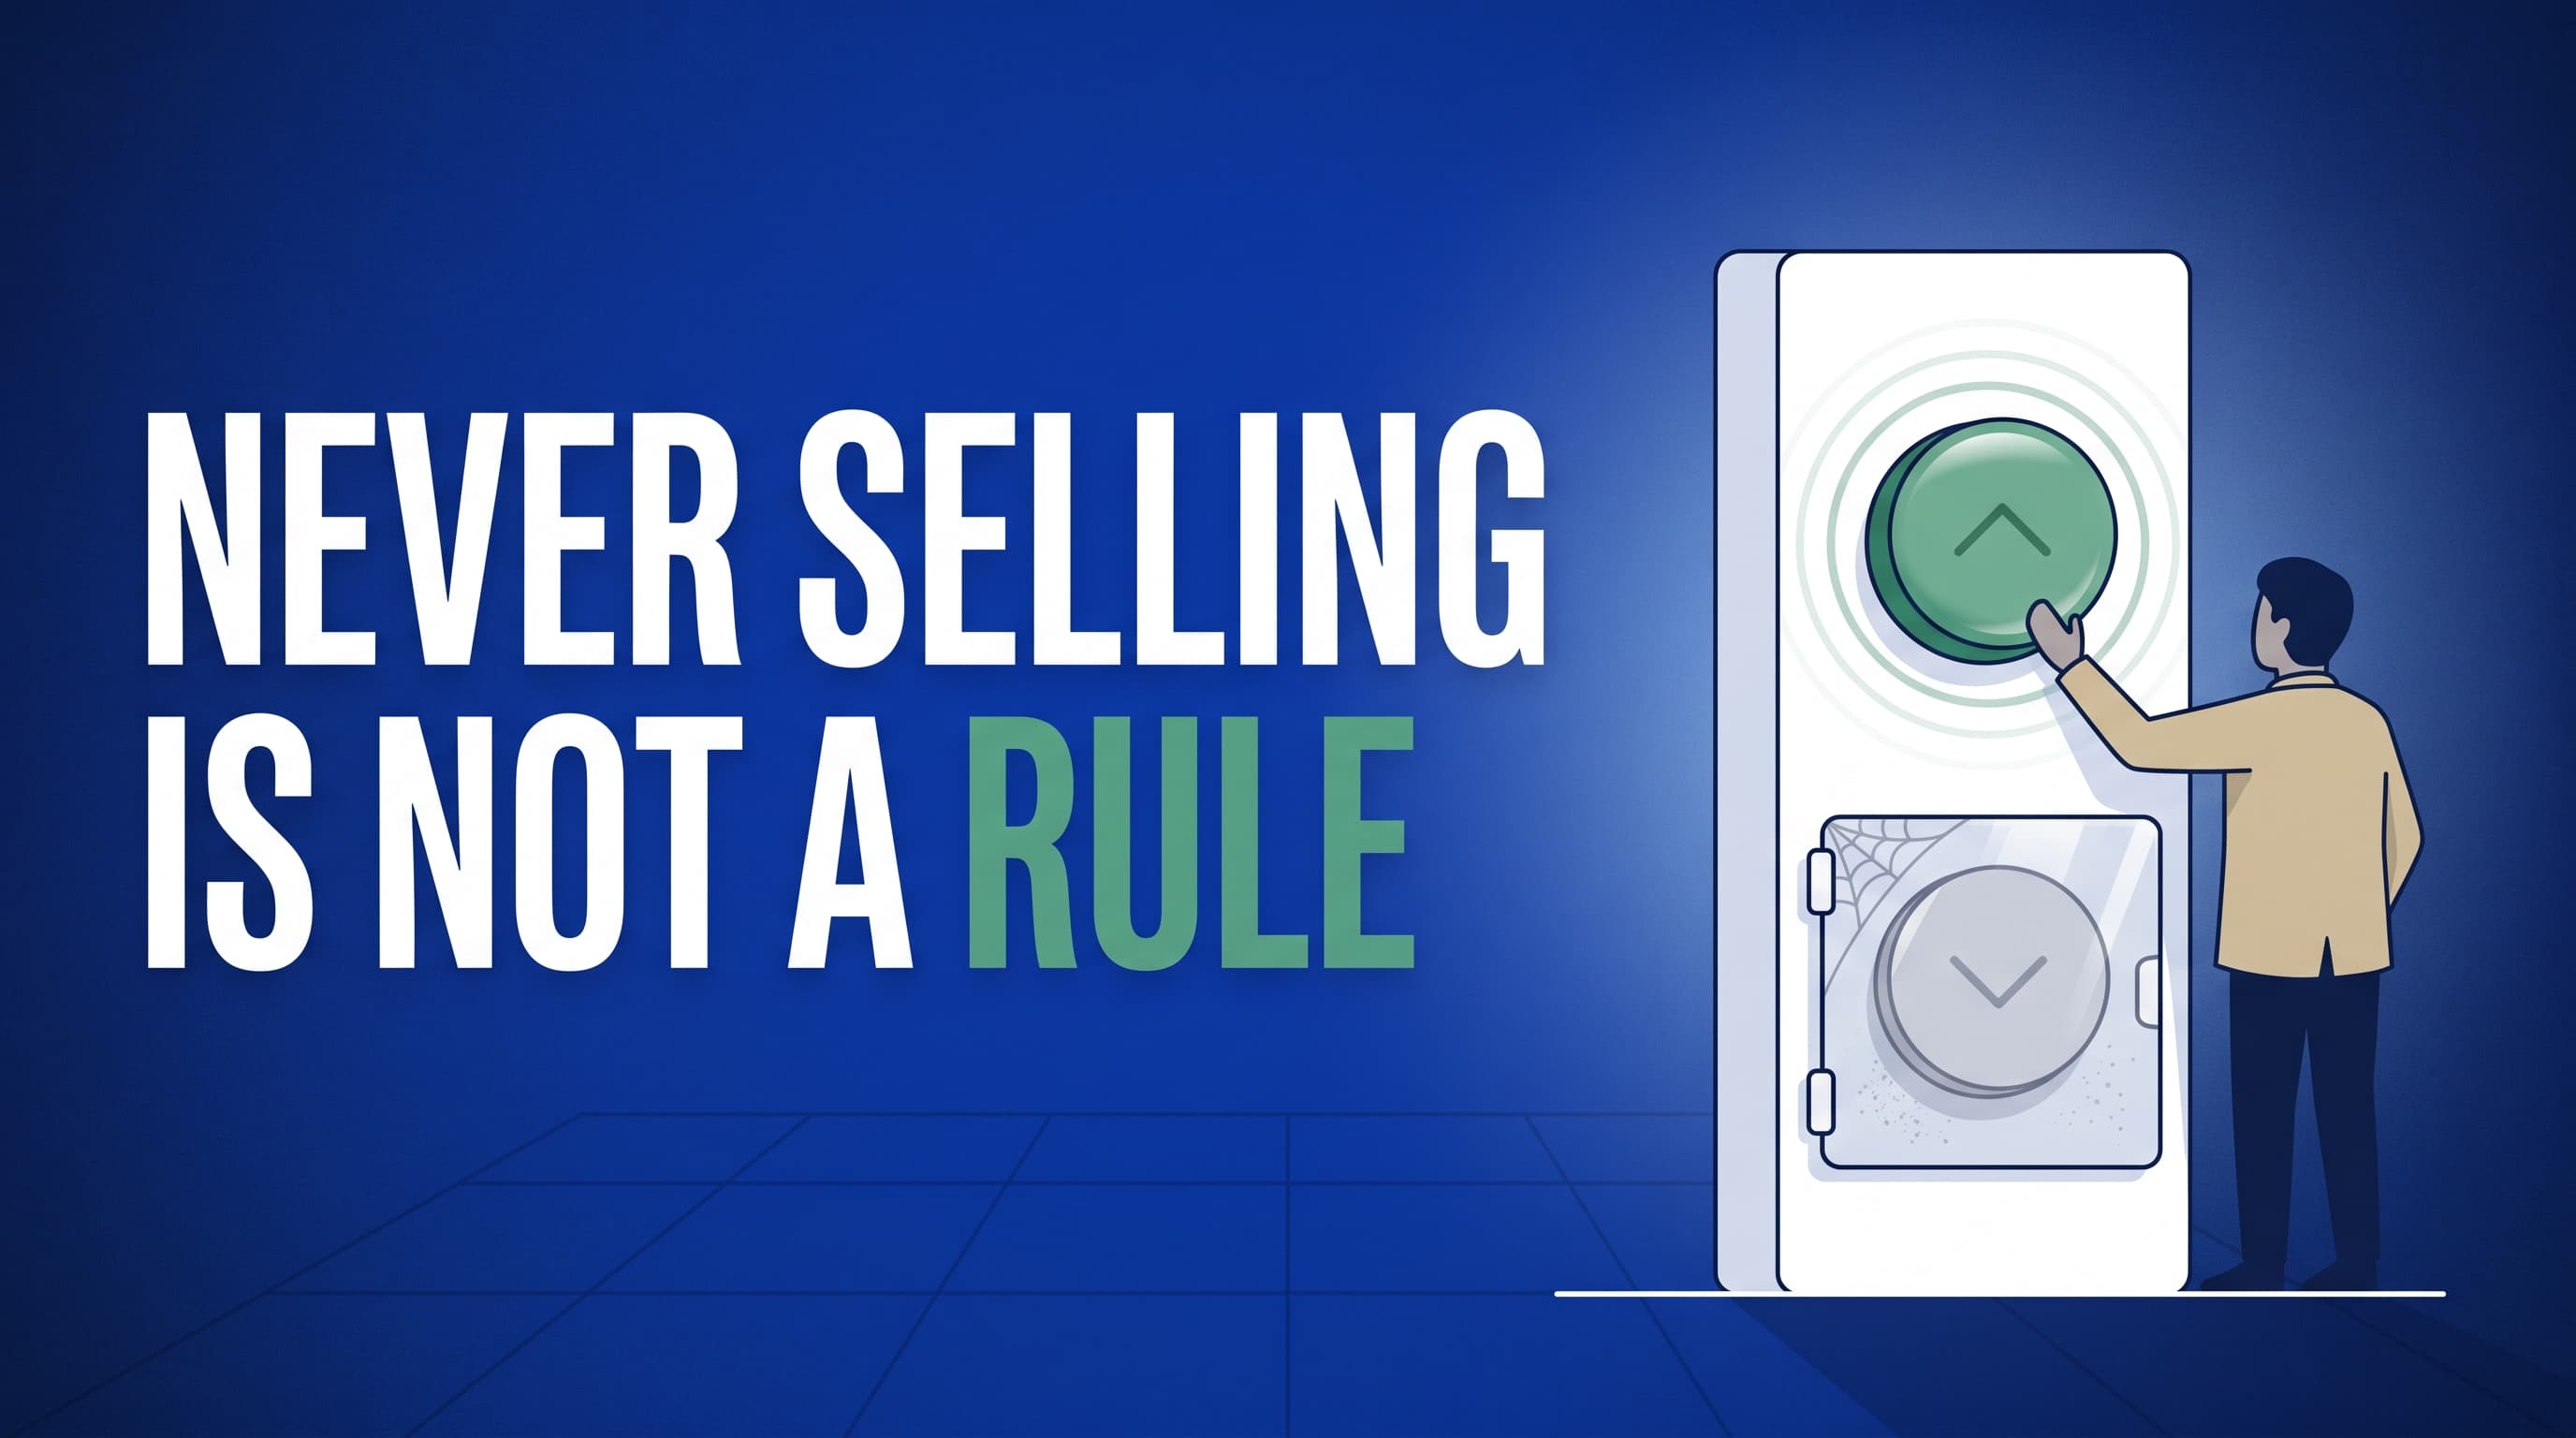
Not on a price or a date. Sell index funds only when one of four written-down tests is met, and keep a never-list for when panic poses as a plan.
 Learn To Invest
AI Investing Advice: Why ChatGPT Sells Conviction, Not Edge
Four in five young UK investors use AI for investing, and most know it can be wrong. One test for AI advice: does it remove decisions or manufacture them?
 Learn To Invest
Investing at All-Time Highs: What a CAPE of 41 Predicts
Valuation explains about 26% of the next decade's returns and 4% of the next year's. So high prices belong in your return assumption, not your monthly buy.