4 Ways Families Are Beating the 2026 Housing Crisis
You're looking at a $500,000 house. Your household income is $85,000. The mortgage payment alone would be $3,000 a month—35% of your gross income, before taxes.
The bank might approve you. But the math feels impossible.
Here's the brutal truth: you're not alone, and it's not your fault.
The price-to-income ratio for homes has nearly doubled from 3.65 in 1980 to 5.08 today—far above the 2.6 recommended threshold. Homeownership rates have dropped 8–10% across every age group since 2000, not just millennials. The median first-time buyer is now 40 years old—up from 32 just a decade ago.
Most articles will tell you to "wait for rates to drop" or "save harder." That's not the real story.
The real story is that traditional homeownership—the 30-year mortgage, the white picket fence—has become a trap for most people. And the financially aware are finding ways around it.
This article reveals the strategies people are actually using in 2026: multigenerational homes saving 30–50% on housing costs, co-buying cooperatives with legal structures that work, house hacking with accessory dwelling units (ADUs) generating $1,200–$4,000 monthly, and rent-and-invest arbitrage that often accelerates wealth-building faster than buying ever could.
The paradox? The housing affordability crisis is an opportunity for FIRE-minded people. You just need to see it differently.
The Affordability Breakdown: Who's Actually Getting Hurt
Media coverage focuses on millennials locked out of homeownership. That's incomplete.
The crisis spans all generations equally:
| Age Cohort | 2000 | 2022 | 2026 | Decline |
|---|---|---|---|---|
| 30–34 | 52% | 43% | 41% | -11 pp |
| 35–39 | 60% | 50% | 48% | -12 pp |
| 40–44 | 70% | 59% | 57% | -13 pp |
| 45–49 | 75% | 65% | 63% | -12 pp |
| 50–54 | 78% | 69% | 67% | -11 pp |
This isn't cyclical. It's structural.
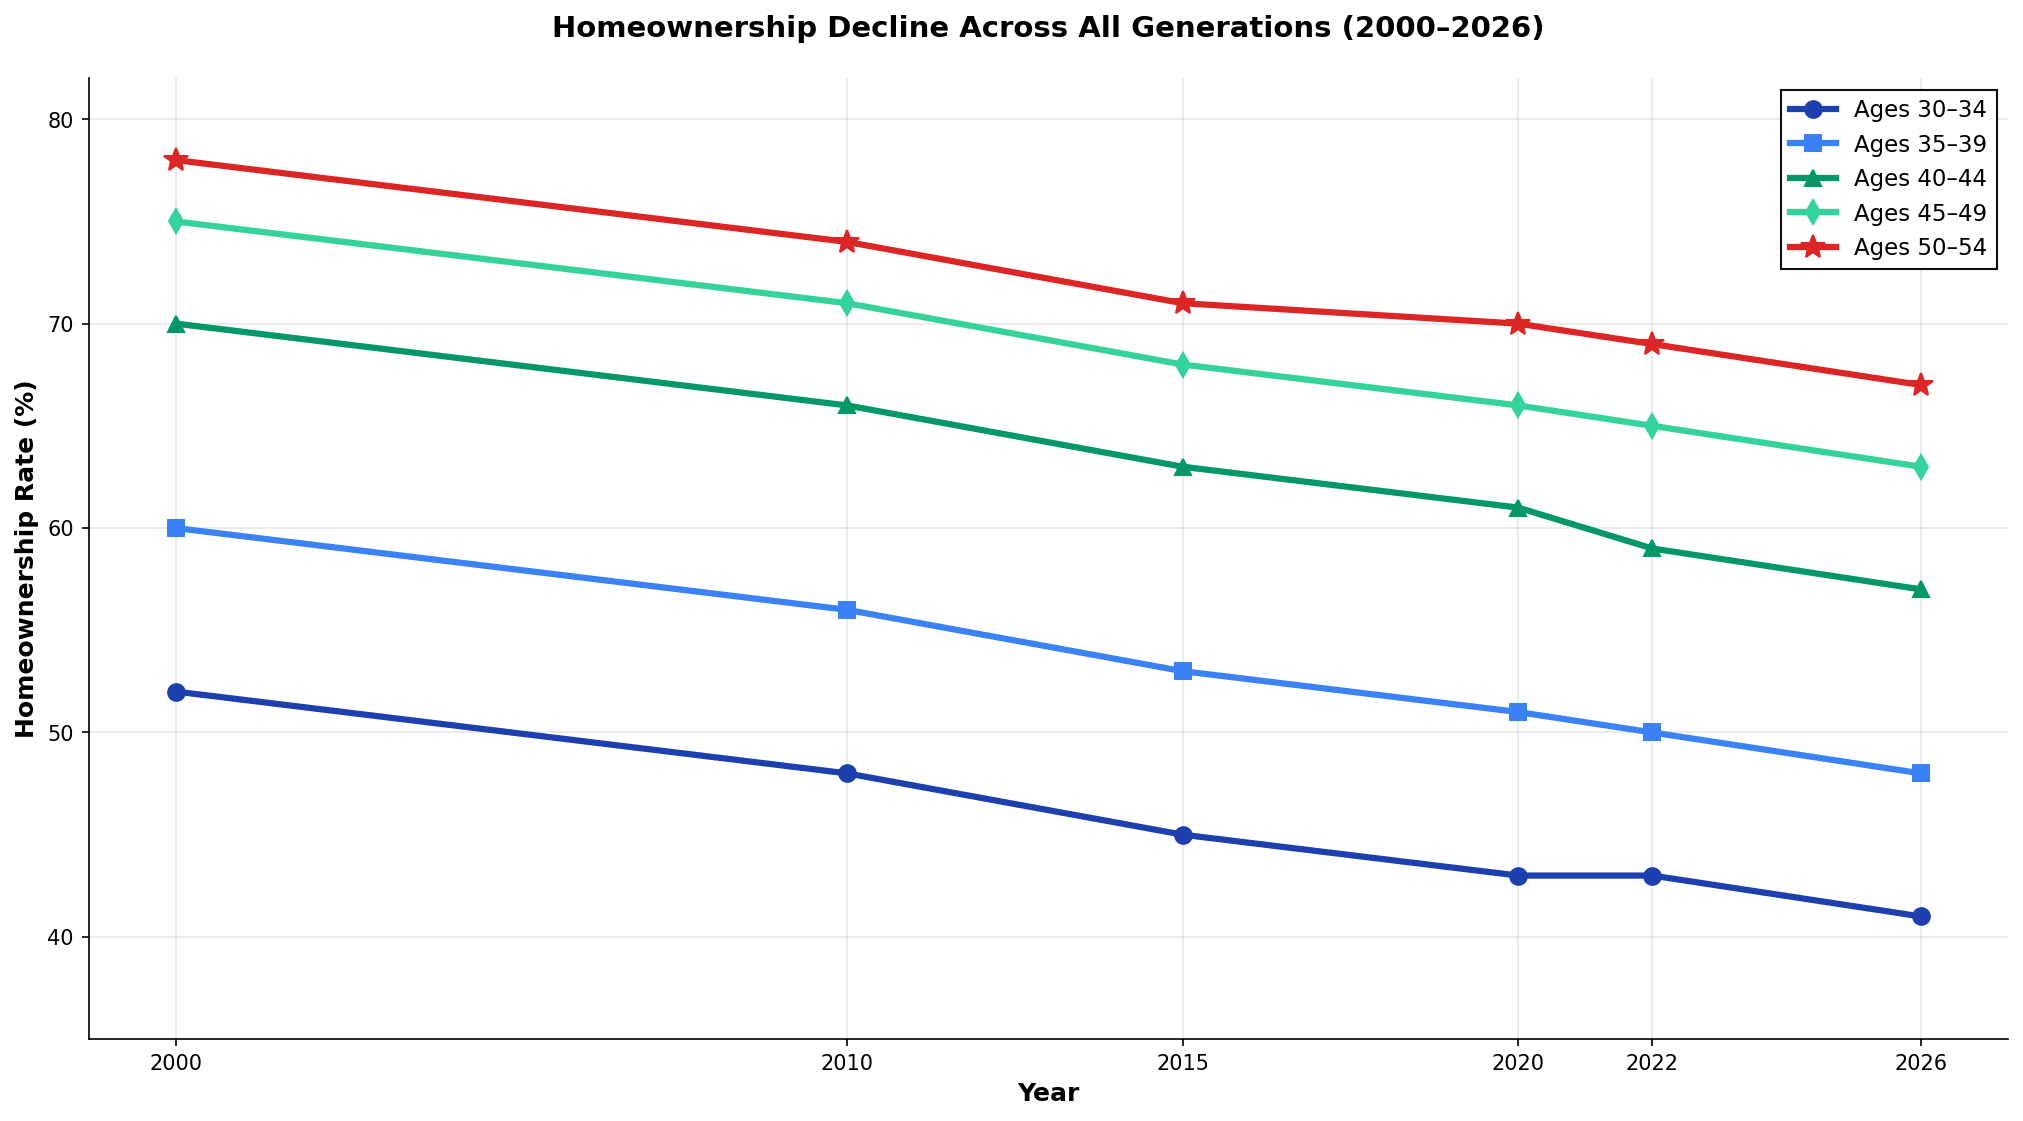
The numbers paint a clear picture: every generation is buying less, later, or not at all. Gen X (ages 45–60) is quietly becoming the primary buyer now—not because they can afford homes, but because they're using their accumulated wealth and purchasing power to access them through creative structures (multigenerational arrangements, co-buying with adult children, etc.).
Meanwhile, median home prices sit at $414,900 while median household income is $81,604. Only 21% of available homes are affordable to middle-income earners today, down from roughly 50% before the pandemic.
This is the context you're operating in. And it's not improving anytime soon.
Why Traditional Ownership Feels Impossible (And the Real Math)
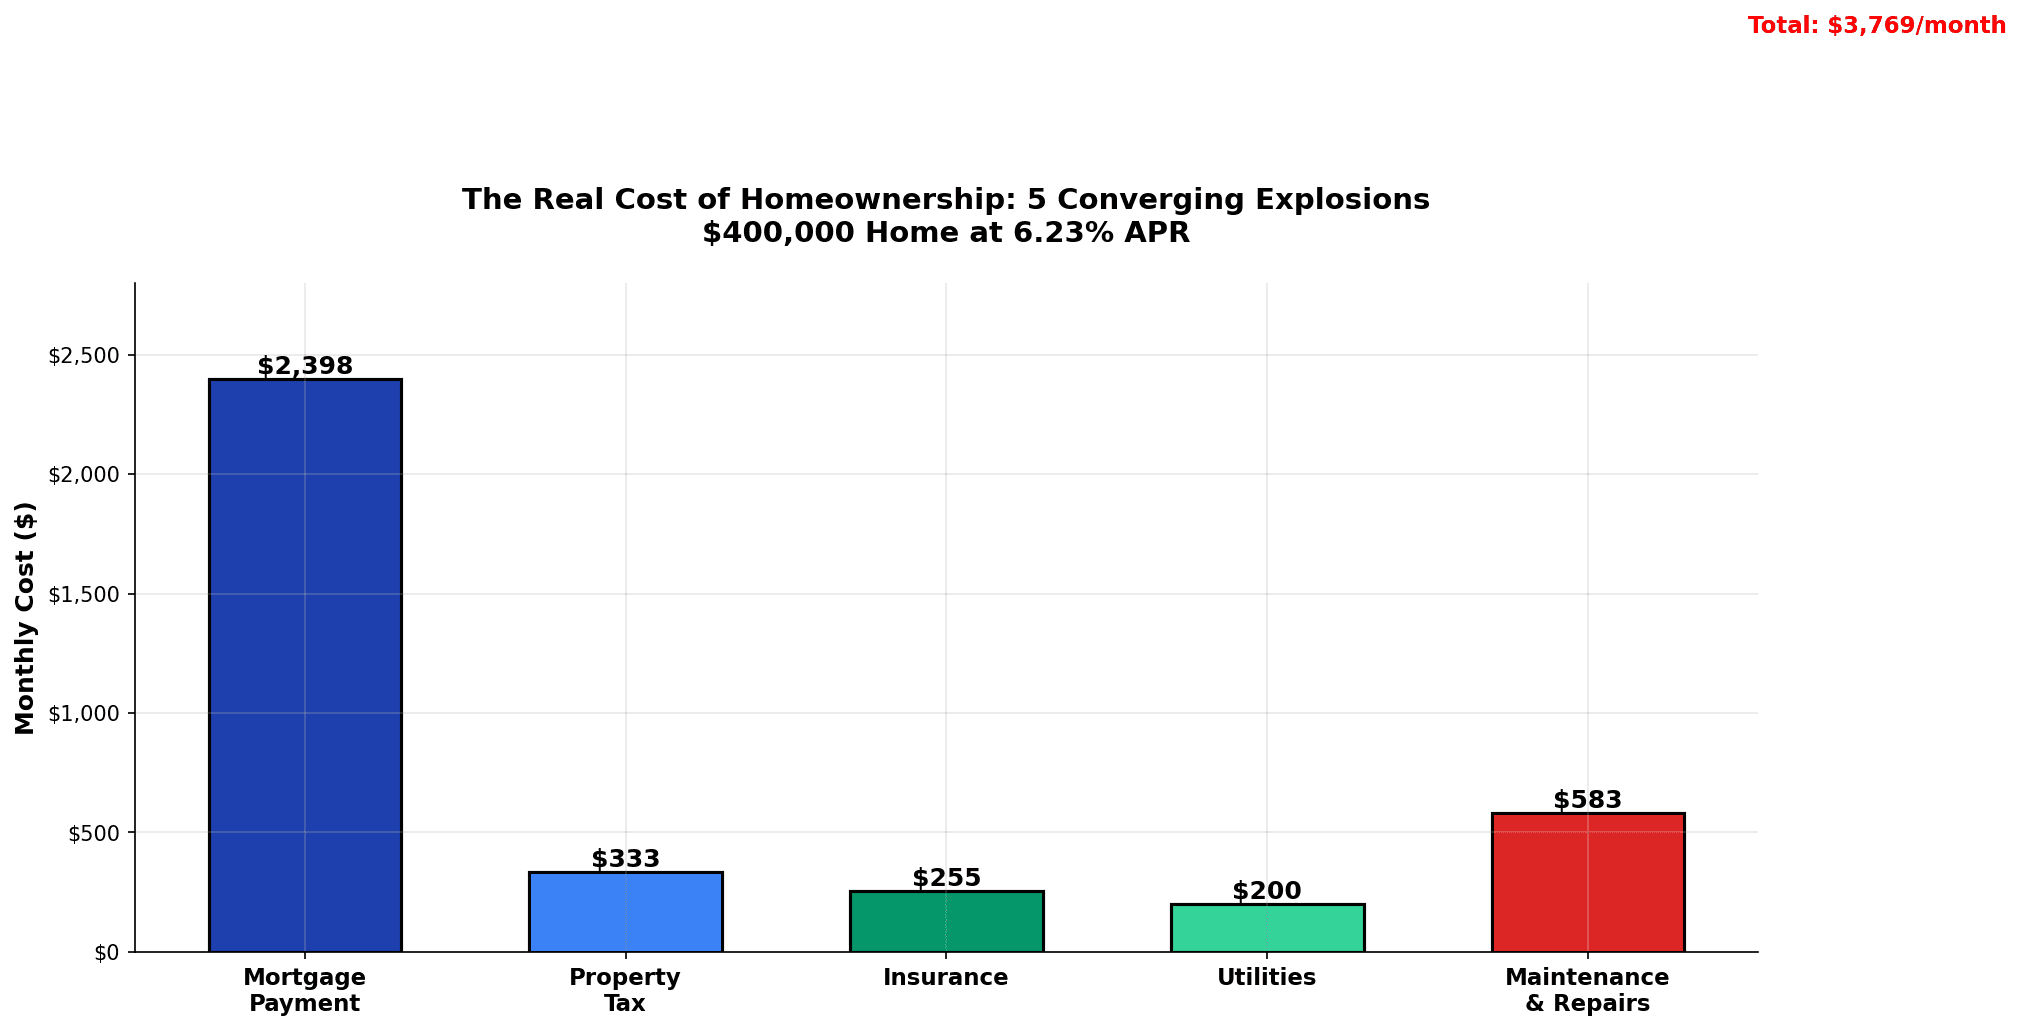
There are five converging cost explosions happening simultaneously:
1. Home prices outpacing income growth
Since 1980, home prices have risen 551% while incomes grew only 373%. The gap compounds every year. In 1980, you could buy a median home on 3.65 years of household income. Today, it takes 5.08 years.
2. The mortgage rate lock-in
Interest rates determine affordability more than prices do. At 6.23% (April 2026), a $400,000 mortgage costs $2,398 monthly. If rates hit 7%, that same home costs $2,661—$263 more per month, or $94,680 more over 30 years. For someone living paycheck-to-paycheck, 50 basis points is the difference between "possible" and "impossible."
3. Insurance premium explosion
Homeowners insurance premiums are rising 4% annually and hit an average of $3,057 in 2026—up 12% just in 2025. Some states saw 15–20% increases. This is often overlooked in affordability calculations but adds $250–$300 monthly to effective housing cost.
4. Property tax creep
As home values rise, so do property taxes (in most states). A home appreciating from $300,000 to $500,000 might see property tax jump from $3,000 annually to $6,000—a hidden $250/month increase.
5. Maintenance and utilities
Older homes (often the only "affordable" options left) require $5,000–$10,000 annually in repairs and maintenance. Utilities for a 2,000 sq ft home average $150–$250 monthly depending on region.
Combined, these five forces mean the effective monthly cost of homeownership is 40–50% higher than just the mortgage payment.
Most affordability calculations ignore this. They shouldn't.
Strategy 1: Multigenerational Housing—The Fastest Path to Affordability
If you have the option to house a parent, an adult child, or even a sibling under one roof, the math is striking.
The Chen family is a real example. Anna, age 68, owns a paid-off 4-bedroom home worth $750,000 in a high-cost area. Her daughter Sarah, age 42, was paying $3,200/month rent for a 2-bedroom apartment with her two kids.
They formalized a multigenerational arrangement.
Here's how it worked:
- Anna continues living in the home rent-free (she owns it outright)
- Sarah and her kids move in, contributing $800/month for utilities, groceries, and household expenses
- Anna's property tax and insurance remain ~$400/month, which they share
- Sarah gains 600 sq ft of personal space for her family
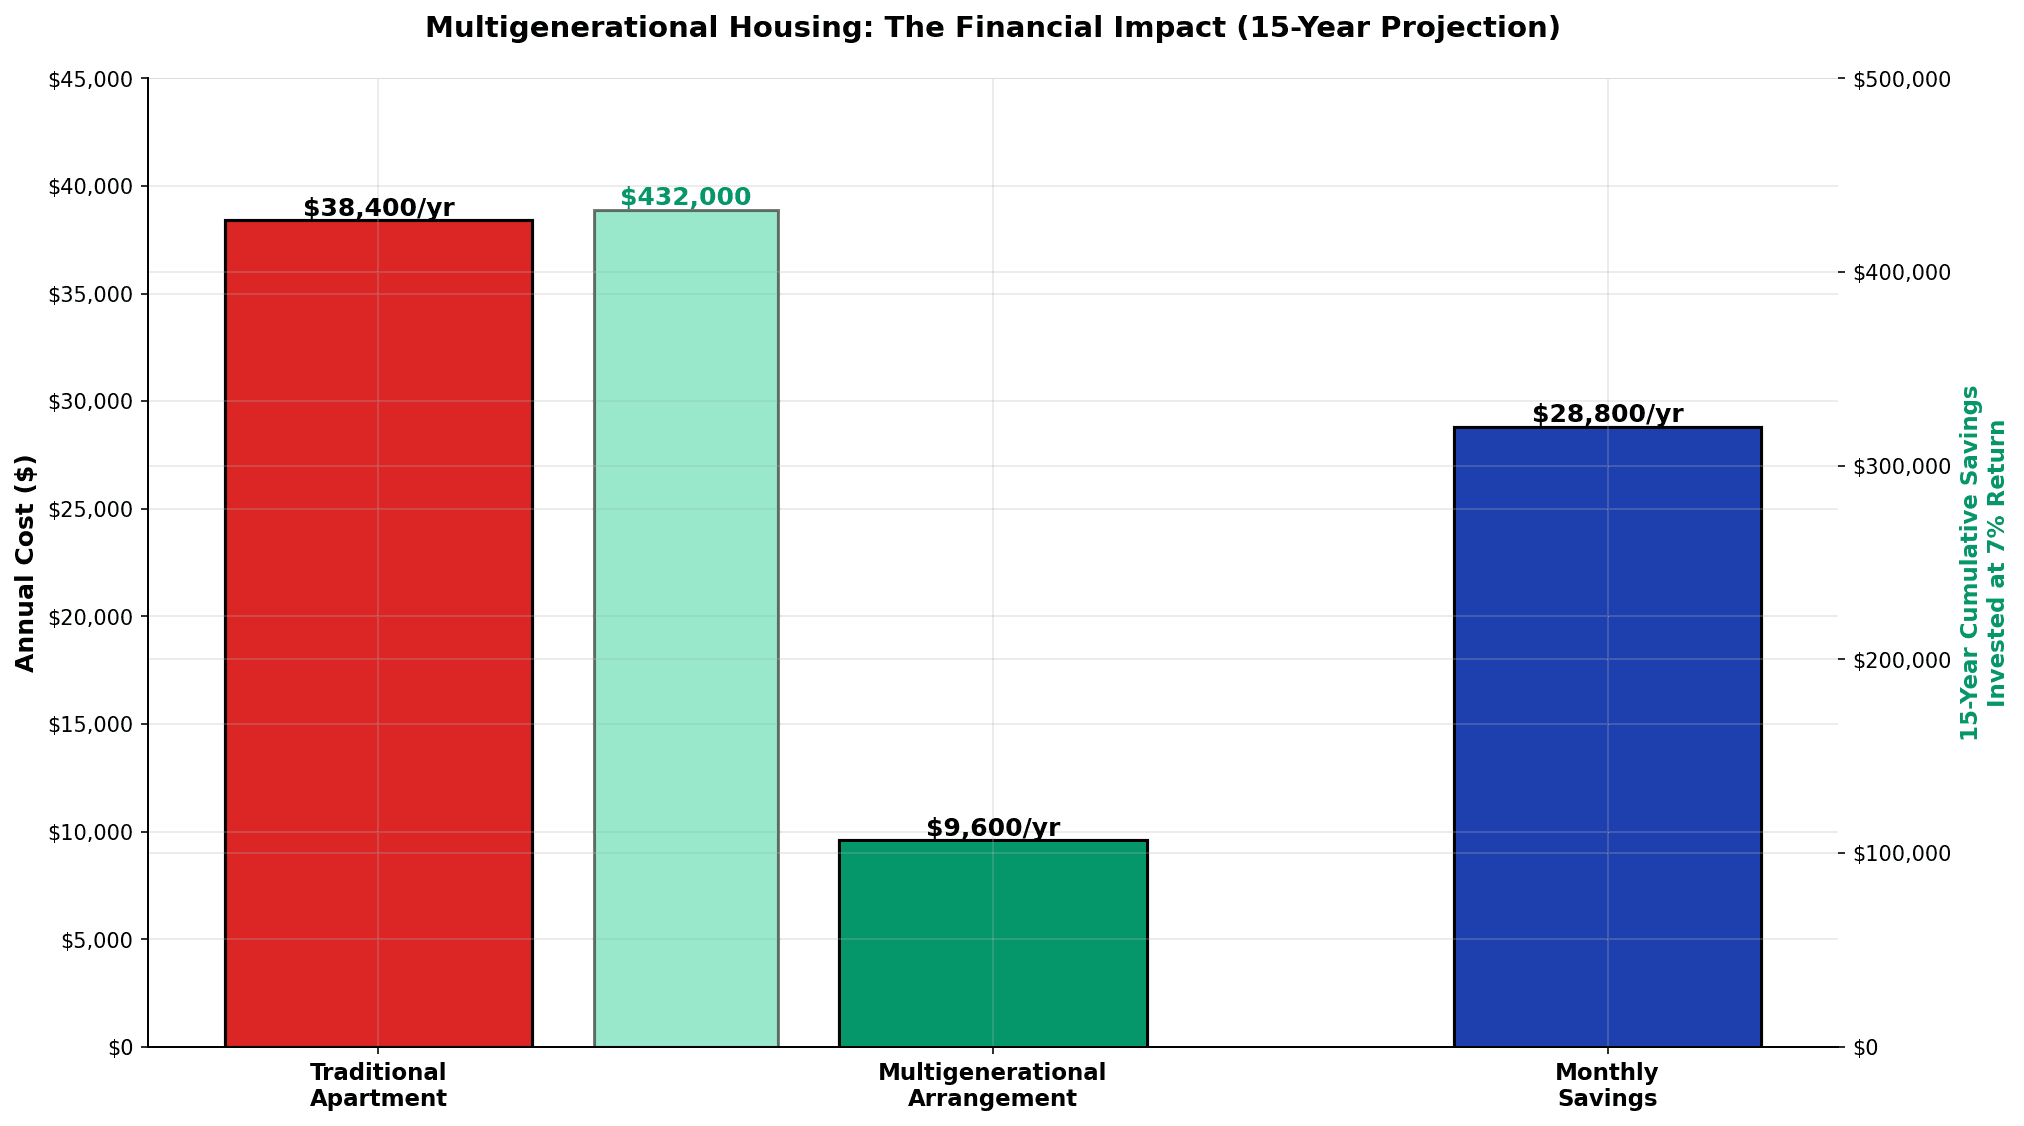
The result: Sarah's housing cost dropped from $3,200 to $800/month—a $2,400 monthly savings.
Over 15 years, that $2,400/month redirected to a brokerage account—invested in index funds at 7% annual returns—accumulates to $432,000.
For a FIRE-focused person, this potentially cuts years off the path to financial independence.
The legal side matters. Most multigenerational arrangements fail because they're informal. What works:
- Written cohabitation agreement — clearly defines who pays what, for how long, and what happens if someone wants to leave
- Documented expense log — shared spreadsheet showing utility costs, groceries, maintenance splits
- Tax clarity — confirm whether the contributing family member is rent-paying (not tax-deductible to homeowner) or a caretaker (potential deductions for elder care)
- Exit clause — what if Sarah wants to move out? What if Anna wants to downsize? Define this upfront.
The cost savings alone are massive. But add in the non-monetary benefits—shared childcare, built-in elder care, reduced isolation—and multigenerational housing becomes the most underutilized wealth-building strategy in America.
Strategy 2: Co-Buying & Cooperative Ownership Models
Marcus, age 37, and his brother James, age 34, both earned solid incomes ($65,000 and $60,000) but couldn't individually qualify for a $450,000 home. Together, they needed a different structure.
They co-bought a $560,000 fourplex using a tenancy-in-common (TIC) deed—a legal arrangement where multiple people own fractional shares of the same property.
Here's the structure:
- Purchase price: $560,000
- Down payment (3% FHA): $16,800 split two ways = $8,400 each
- Total upfront: $16,800
- Mortgage: $543,200 split proportionally
- Unit arrangement: Marcus in Unit 1, James in Unit 2, Units 3 & 4 rented at market rate ($1,400 and $1,200/month)
Monthly math:
- Combined mortgage + tax + insurance: $4,500
- Rental income from Units 3 & 4: $2,600
- Net housing cost: Marcus and James each pay ~$950/month (roughly the cost of renting a 1-bedroom)
By year 5, both had built $140,000+ in equity each. The property appreciated 12%, adding another $67,000 in combined value.
The catch: TIC structures require clear legal documentation. Things that must be defined upfront:
- Exit strategy — if Marcus wants to sell his share, how is James protected? (Right of first refusal clause)
- Death/incapacity — what happens to the deed if Marcus dies or becomes incapacitated?
- Financing coordination — both owners must refinance together; if one person's credit tanks, it affects both
- Property management responsibility — who handles repairs, tenant issues, etc.?
- Liability — both owners are jointly liable for the full mortgage, not just their share
The legal cost upfront ($2,000–$3,000 for a proper TIC agreement) is trivial compared to the benefit. Marcus and James saved $300,000+ in down payment requirements compared to buying separately.
For anyone exploring co-buying, understanding the legal foundation is critical. This is where How Do Mortgages Work becomes essential reading—you'll understand how shared debt obligations function in a co-owned property.
Strategy 3: House Hacking—The ADU Play for 2026
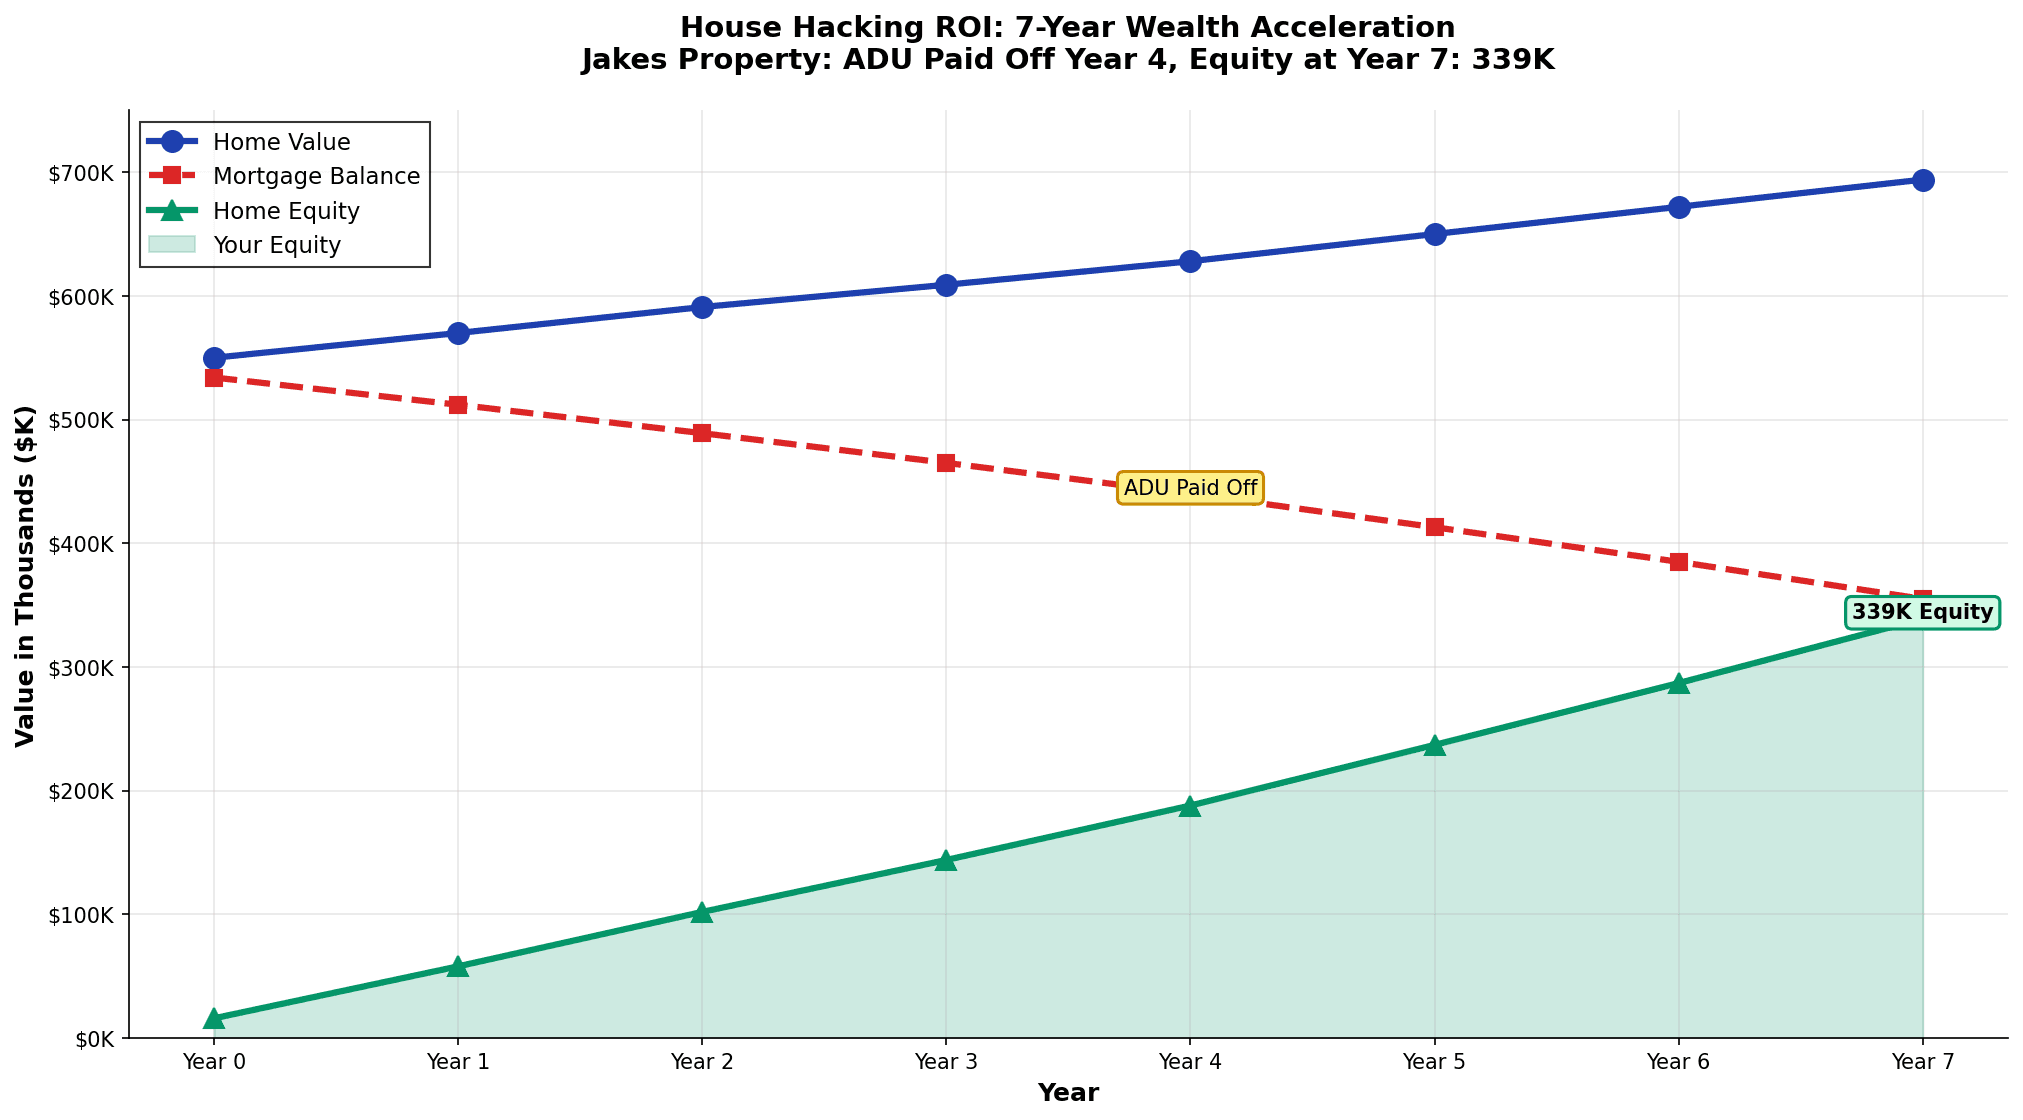
Jake, age 29, faced the same impossible math: home prices in Portland had climbed to $550,000+, but his salary was $55,000. A traditional 30-year mortgage would consume 40% of gross income.
Instead, he bought the home with a 3% FHA down payment ($16,500) and immediately built an accessory dwelling unit (ADU)—a separate 600 sq ft apartment in the backyard.
The build:
- Home purchase price: $550,000
- Down payment: $16,500 (3%)
- ADU construction cost: $85,000 (prefabricated, included labor)
- Total capital required: $101,500
The income:
- ADU rental income: $2,200/month
- Jake's mortgage + tax + insurance: $3,300/month
- Net housing cost: $1,100/month (he effectively gets $1,100/month subsidy from the tenant)
The ADU paid for itself in approximately 4 years through cumulative rental income. After that, every rent payment went to accelerating his mortgage payoff and building equity.
In 5 years, the home appreciated to $620,000. Jake had built $150,000+ in equity while living mortgage-free. By year 7, the home was nearly half-paid off—a situation that would've taken 14+ years on a traditional 30-year mortgage.
The 2026 advantage: Zoning reforms in California, Washington, Oregon, and other states have dramatically loosened ADU restrictions. Most urban areas now allow ADUs by-right (no variance needed), and some cities provide grant programs to cover 30–50% of construction costs.
The ROI formula is simple: total ADU cost ÷ monthly rent × 12 = payback period in years.
For Jake: $85,000 ÷ $2,200 × 12 = 3.2 years to break even.
That's a compelling return, especially with concurrent property appreciation and mortgage principal paydown.
But understand the prerequisites:
- Local zoning permits ADUs — check your city's zoning code first
- Sufficient lot size — most ADU regulations require 3,000–5,000 sq ft of lot
- Construction financing — you'll need to arrange a construction loan or HELOC to build the ADU (doesn't come from home purchase mortgage)
- Tenant management skills — you're now a landlord; vacancy, maintenance, and tenant relationships matter
For FIRE-focused people, house hacking is a shortcut to real estate wealth without the complexity of being a full-time investor.
Strategy 4: Rent-and-Invest vs. Buy-Now Arbitrage
This is the most counter-intuitive strategy, and it's where housing affordability becomes a wealth advantage.
Here's the fundamental question: In your market, is it cheaper to rent or buy?
There's a metric for this: the rent-to-price ratio. Divide annual rent on an equivalent property by the home price. If the ratio exceeds 1:20 (5%), renting is likely cheaper. Below 1:25 (4%), buying usually wins.
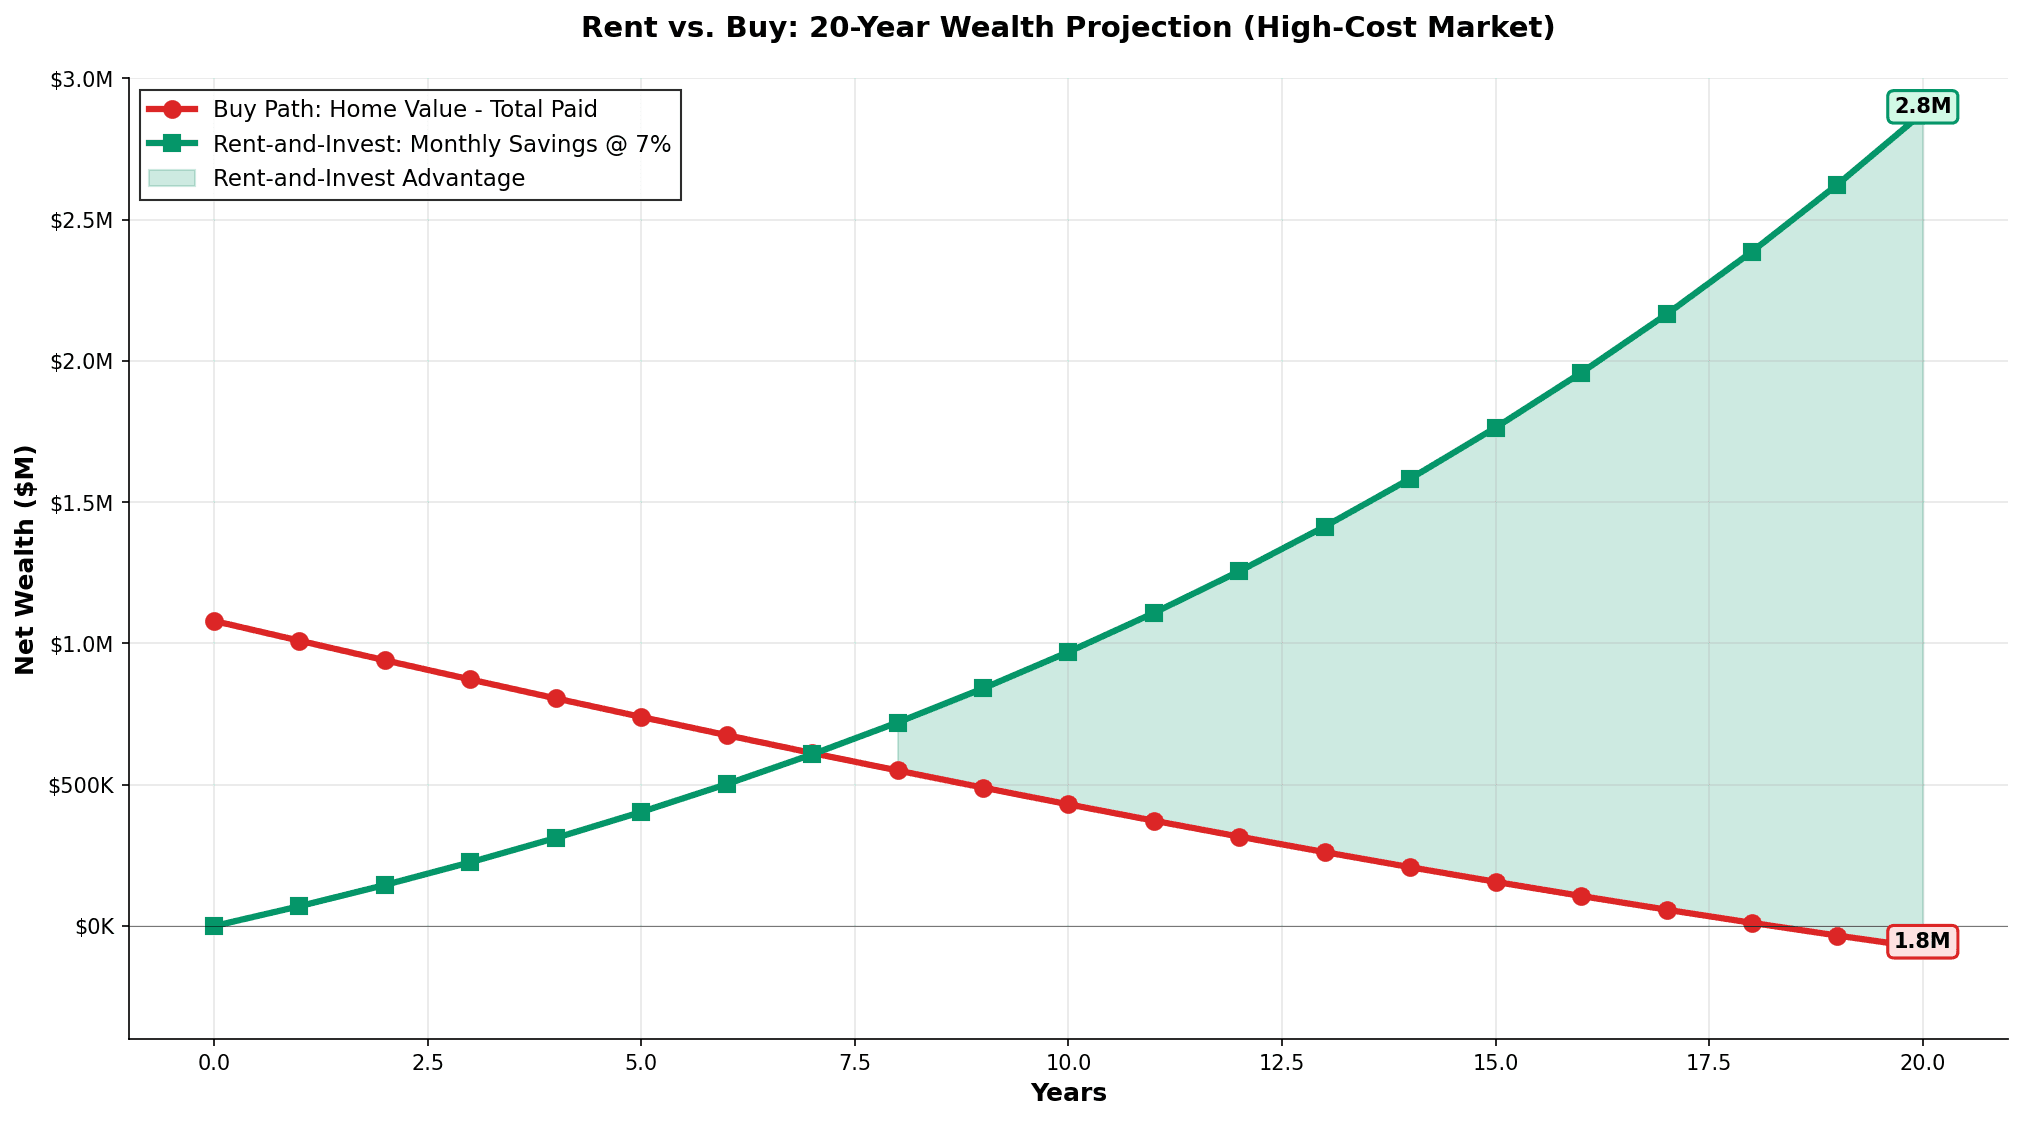
In San Jose in 2026, a $1.2 million home rents for $3,000/month ($36,000 annually). That's a 3% rent-to-price ratio. In this market, renting wins decisively.
Here's why:
Buy the home for $1.2M:
- Down payment: $120,000
- 30-year mortgage at 6.23%: $7,200/month
- Property tax (1.25% CA): $1,250/month
- Insurance: $200/month
- Maintenance: $200/month
- Total monthly cost: $8,850
Rent the equivalent and invest the difference:
- Rent: $3,000/month
- Savings available to invest: $5,850/month
Over 20 years, that $5,850/month invested at 7% returns compounds to $2.8 million.
The home bought for $1.2M appreciates to approximately $1.8M (3% annually).
The rent-and-invest strategy nets $1M more wealth than buying.
This math changes based on your market. In Pittsburgh (rent-to-price 3.07), buying might win. In Austin (rent-to-price 5.5), renting overwhelmingly wins.
For deeper analysis on the fundamental comparison between these paths, read Invest vs Mortgage to understand the psychology and long-term implications of each choice.
The key insight: high housing costs are an advantage for FIRE-focused people who choose to rent. Every dollar you don't spend on a down payment, mortgage, taxes, and maintenance is a dollar you can invest. And investments compound much faster than home appreciation does.
How Housing Affordability Affects Your FIRE Timeline
This is where it gets personal.
Most FIRE calculators focus on income and investment returns. They overlook the single largest expense in your budget: housing.
The wealth equation is simple: Wealth = (Income - Housing - Taxes - Other Expenses) × Time × Investment Return
Housing is often 28–35% of income for traditional homeowners. For FIRE-focused people using the strategies above, it can drop to 12–18%.
That difference is massive.
Let's say you earn $80,000 annually (after taxes, roughly $60,000 net).
Scenario A: Traditional homeownership
- Housing cost: $1,800/month (30% of income) = $21,600/year
- Remaining for expenses + investing: $38,400/year
- Invest at 7% return over 25 years = $2.9M net worth (FIRE achieved)
Scenario B: Multigenerational arrangement
- Housing cost: $600/month (10% of income) = $7,200/year
- Remaining for expenses + investing: $52,800/year
- Invest at 7% return over 25 years = $4.0M net worth (FIRE achieved)
You hit FIRE 3+ years earlier by optimizing housing.
That's not luck. That's the power of treating housing as an investment decision, not an emotional one.
For people focused on Wealth, Time, Money, and Discipline, housing choice is the #1 leverage point in your financial life. The right housing decision compounds for decades.
Action Plan: Testing Your Housing Strategy
Stop theorizing. Test your specific situation.
Step 1: Know your market's rent-to-price ratio
Look up the median home price in your area (Zillow, Redfin). Find the median rent for an equivalent property (Apartments.com, Zillow rentals). Divide annual rent by home price.
- Over 5% (1:20 ratio): Renting likely wins
- 3–5% (1:20 to 1:33 ratio): Market-dependent
- Under 3% (1:33 ratio): Buying likely wins
Step 2: Model three scenarios using your current income, savings, and investment assumptions
Use MFFT's net worth tracker or a spreadsheet. Project 20 years with:
- Traditional buy: $X down payment, 30-year mortgage at current rates, property tax, insurance, maintenance. Assume 3% annual appreciation.
- Rent-and-invest: Current rent, invest the difference monthly at 7% annual return.
- Alternative housing: Multigenerational arrangement, co-buying, or house hacking. Use real numbers from your situation.
Step 3: Identify your housing opportunity
- Do you have a parent or adult child who could join your household (multigenerational)?
- Do you know a trusted friend or sibling open to co-buying (TIC structure)?
- Does your local zoning allow ADUs, and does the ROI math work?
- Is your market's rent-to-price ratio high enough to favor rent-and-invest?
Step 4: Take one concrete action
- Call a real estate attorney to discuss TIC structures ($200 consultation)
- Check your city's zoning code for ADU legality
- Run the rent-to-price calculation for your actual address
- Have a conversation with the family member about a multigenerational arrangement
The housing affordability crisis feels like a wall. But when you zoom out and see the strategies, it becomes a set of levers you can pull.
The FIRE Perspective: Housing Constraints as Opportunity
Here's the counterintuitive truth that most financial content misses:
The housing affordability crisis is not a barrier to FIRE. It's an accelerant.
Traditional wisdom says you need to buy a home to build wealth. That's outdated.
In 2026, the most financially sophisticated people I know are not rushing to buy expensive homes. They're renting in high-cost markets, redirecting $500–$1,500 monthly to diversified investments, and building wealth 2–5 years faster than homeowners.
Others are using co-buying, multigenerational arrangements, and house hacking to own homes without the traditional debt trap.
The people struggling are those who were told, "A home is your best investment." They over-leveraged, locked in low equity on high prices, and now have limited flexibility to adapt when their income, family structure, or location needs change.
You're different. You're reading this, thinking carefully about the math. For someone committed to the FIRE Movement, this article should crystallize one key insight: housing decisions are FIRE decisions.
That puts you in the top 5% of financial decision-makers.
The housing affordability crisis is real. But for people willing to think creatively, it's the greatest opportunity to build wealth faster than the previous generation did.
The only requirement: Stop following the default path.
Next Steps
- Calculate your personal affordability threshold using the rent-to-price ratio and market-specific data
- Run your three-scenario projection using MFFT's net worth tracker
- Explore your housing option — whether that's multigenerational, co-buying, house hacking, or intentional renting
- Talk to a professional — real estate attorney for co-buying, tax advisor for multigenerational implications, lender for ADU financing
The housing affordability crisis isn't going away. But your response to it will determine whether you reach financial independence in 10 years or 20.
Choose wisely.
Stay Updated
Get notified when we publish new articles.
Ready to Apply This?
Start tracking your finances today and put these tips into practice.
- Import bank statements in seconds
- AI-powered categorization
- Beautiful visualizations
- Set and track financial goals
Related posts
 Master Your Money
The Sunday Money Reset: The 15-Minute Weekly Habit Beating Monthly Budgets in 2026
Weekend budgeting is winning in 2026: a 15-minute Sunday Money Reset that catches overspending weekly — the exact 6-step checklist and the science.
 Master Your Money
Quiet Saving: How to Build Wealth Without Telling Anyone (The 2026 Anti-Flex Trend)
Quiet saving is the 2026 anti-flex money trend: automate your savings, skip the loud posts, and build wealth privately. Here is the system and the math.
 Master Your Money
Money Dysmorphia: Why You Feel Broke When You’re Fine
83% of Americans report money stress while only 16% feel fulfilled (Edward Jones/Gallup, 2026) — often despite healthy numbers. The 5 signs and the fix.
 Master Your Money
AI Scams Stole $21 Billion: How to Protect Yourself in 2026
AI scams hit a record $20.9B and could reach $40B by 2027. Scammers clone a loved one's voice from 3 seconds of audio. Here's the calm, free, afternoon-long defense playbook to protect your money in 2026.
 Master Your Money
Prediction Markets: Why 69% of Polymarket Users Lose
69% of Polymarket users lose money and the top 1% take 76.5% of profits. The math, why Gen Z is targeted, and a 30-day reset plan.