Investing at All-Time Highs: What a CAPE of 41 Predicts

The transfer went out the day after payday, same as every month, and I have no idea whether I got a good price.
One world ETF, an amount I haven't touched in months, bought while the Shiller CAPE printed 41.18. That is the 19th-highest monthly reading in 1,748 months of records going back to 1881. Here's the part I had to sit with for a while: the other eighteen all fall between March 1999 and September 2000. Every single one of them. So investing at all-time highs in August 2026 means buying at a valuation the market has only ever visited during a bubble that everybody now agrees was a bubble, with a standing order I set up years ago and never looked at again.
I did change a number this month. It just wasn't that one.
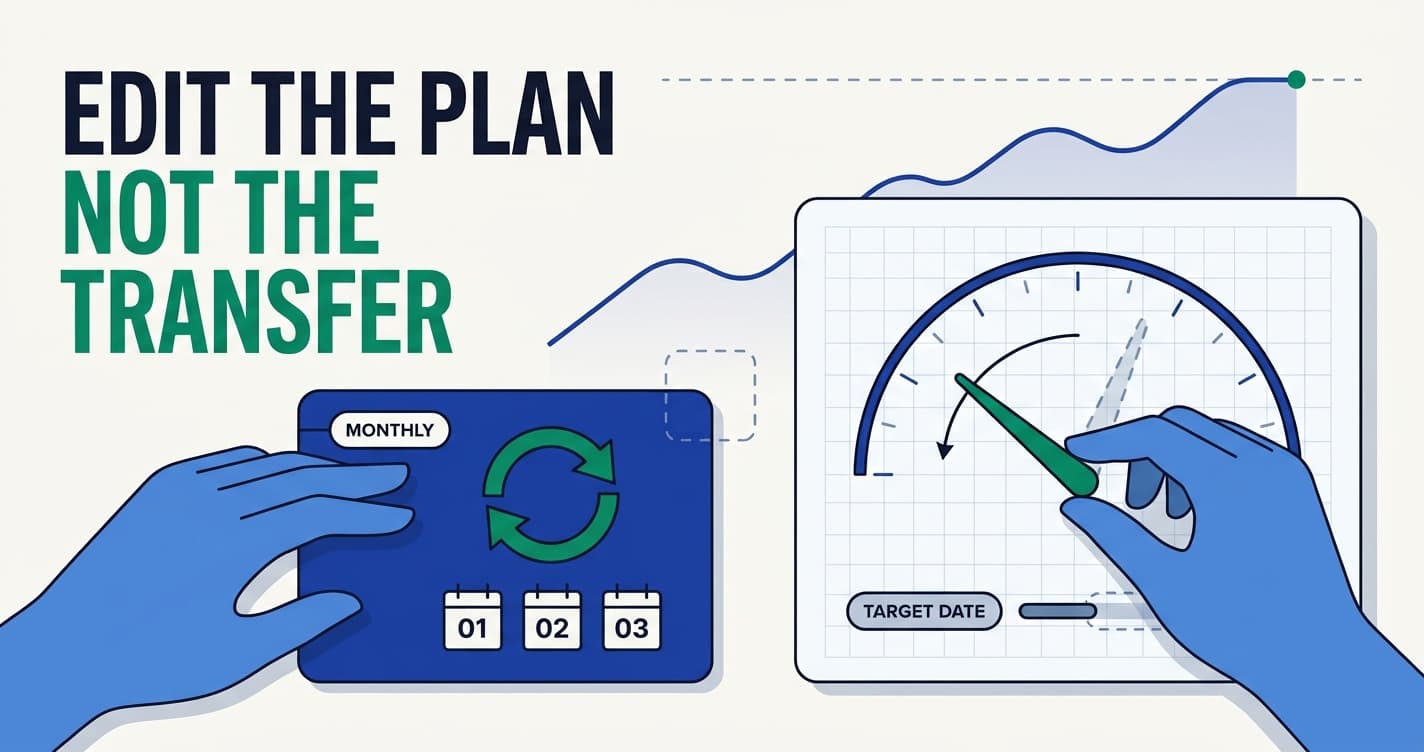
There are two dials here and people keep treating them as one. There's the transfer — the amount, the date, the thing that leaves your account. And there's the return figure buried inside whatever you plan with, the one that quietly converts your contributions into a finish line. Almost everyone I've read this month is fiddling with the first and hasn't opened the second in years.
That's backwards. And it's backwards in a way you can actually measure.
What investing at all-time highs actually predicts
Two ideas keep getting welded together in these conversations, and they behave completely differently.
The first is the record high itself. Records are ordinary. Since 1900, 22.6% of months have set a new real all-time high and 42.6% of months sat within 5% of one. Since 1950 it's 27.2% and 52.5%. RBC counts 1,325 record closes since 1950, more than seventeen a year. Look one year out from each of those and a correction worse than 10% turned up only 9% of the time, and the broad US market has never been down more than 10% five years after any of them.
Comforting. This is also where every article on the subject stops, so let me keep going, because I ran the thing myself and it gets less comforting.
I pulled Robert Shiller's data file and flagged every month since 1900 whose real total-return price beat every month before it. Buying in one of those record months, versus buying in a randomly chosen month, produced a higher real return over one year (+10.28% versus +8.72%) and over three (+7.60% versus +7.18%). Then it turns. Over five years the record-month buyer earned +6.64% against +6.95%. Over ten, +5.95% against +6.71%. And the share of ten-year windows that ended underwater in real terms was 18.4% starting from a record high, against 13.8% starting from anywhere.
 Data: author calculation from Robert Shiller's dataset, shillerdata.com. Monthly starts from Jan 1900; real total return, dividends reinvested, overlapping windows (335 record-high starts vs 1,508 at 1 year, 293 vs 1,400 at 10).
So the popular line is true at one to three years and quietly false at ten. And the reason isn't mystical: months that set records tend to be months where things are expensive. The high isn't the problem. What usually travels with it is.
Which brings me to the number that actually earns its keep. Run the same dataset twice. Starting CAPE explains 25.8% of the variation in the following ten years' real return. It explains 3.9% of the variation in the following one year's. Same file, same measure, two different questions, and a sevenfold difference in how much it knows.
Read that pair honestly and it tells you where valuation belongs. Not in a decision you make this month. In a number that describes a decade.
The dial nobody edits
Ask anyone their monthly investment amount and you get an answer in two seconds. Ask what annual return their plan assumes and you get a pause, a guess, and then some digging. That asymmetry is the entire problem — the plan is making a forecast whether you look at it or not, and nobody is checking it.
If yours says 7% real, it is predicting a better decade than any large house will currently put its name to. Vanguard's June 2026 model run gives 4.2–6.2% for US equities and 4.5–6.5% for developed markets outside the US, nominal, over ten years. J.P. Morgan's long-term assumptions say 7.0% nominal for global equities. Robeco, who are the only ones publishing their own inflation assumption alongside their equity number, land at roughly 3.5% real in euros and 4.0% real in dollars for developed-market equities. GMO says minus 8.1% real for US large caps over seven years.
That last one is not a typo. One serious house says about +4% real and another says minus 8.1% real, for broadly overlapping assets over broadly overlapping periods. Twelve percentage points a year between them. Anybody who tells you confidently what return you should use for retirement planning has not read the other forecasts.
Now watch what happens when you move that number instead of your transfer. Take a plain arithmetic illustration: 100,000 already invested, 2,000 a month going in, a target of 1,000,000, everything in today's money. At 7% real you get there in 16.2 years. At 4% real it takes 20.9. That's 4.7 years of your life, produced by one cell. Or hold the date fixed and the required contribution goes from 2,328 a month to 3,351, which is about 44% more of your income.
 Data: arithmetic illustration computed for this article: 100,000 invested, 2,000 a month, 1,000,000 target, today's money, contributions at month end, no tax, fees or volatility. It is arithmetic in any currency, not a market forecast.
Compare that with the other response. Pausing your transfer for six months moves your finish line by considerably less than 4.7 years, and it hands you no new information whatsoever. It's a feeling with a bank instruction attached.
If you don't know where your assumption physically lives, it's wherever you worked out your FIRE number. Go and read what's in it. Then check whether it's a real or a nominal figure, because plenty of tools don't say, and 7% means two completely different lives depending on the answer.
The pessimists' best evidence is one and a half events
Time to argue against my own tidy story, because the table everyone shares on this topic is weaker than it looks.
Sort 145 years of monthly starts by their CAPE and the forward ten-year real returns fall roughly the way you'd expect. Under 10, you earned 11.29% a year. Ten to fifteen, 7.60%. Fifteen to twenty, 6.04%. Twenty to twenty-five, 4.60%. Above thirty: minus 1.02%. That last figure is the one that gets screenshotted, and today's CAPE of 41.18 sits above the top of the highest bucket entirely.
Now look at the column nobody screenshots. That "above 30" bucket contains 57 monthly observations, and all 57 come from exactly two episodes: 1929, and 1997 through 2002. Overlapping monthly windows dress that up as a sample. It's closer to one and a half things that happened.
And the buckets aren't even monotonic. The 25–30 range, with 107 observations spread across more periods, produced +5.75% average real, which is higher than the 20–25 bucket below it. Restrict everything to starts after 1950 and it gets messier still: 25–30 averaged 6.42% with a worst case of positive 0.64%, while the supposedly cheap 15–20 bucket averaged 6.79%.
 Data: author calculation from Robert Shiller's dataset, shillerdata.com. Monthly starts Jan 1881 – Aug 2016, 1,628 overlapping ten-year windows, full-sample average 6.72%. All 57 observations above CAPE 30 come from two episodes, 1929 and 1997–2002; today's CAPE is 41.18.
The n column is the honest part of that chart, and most people who share the table crop it off.
This cuts both ways, and I'm not going to pretend it only cuts the direction I like. It demolishes the "minus one percent, sell everything" reading. It also demolishes any confidence I might have had about exactly what to type in the assumption box. Which is why the answer isn't a number. It's a band, and you run your plan at both ends of it.
I have already done this once, for a different shock
None of this is theoretical for me. I ran this same play a few months ago, with a very different input.
When our daughter arrived, our household savings rate went from around 60% to around 50%. The monthly amount got smaller. The date moved by roughly six months. What never came up, not once, in any of those conversations, was whether the transfer should keep existing. I wrote up the whole arithmetic of that six months at the time, and the lesson generalises further than I expected.
When reality gets worse, move the amount and move the date. Never move the habit.
The habit is the only part that compounds, and — this is the bit people miss — it's the only part with no scheduled event that turns it back on. A lowered return assumption gets revisited automatically at the next annual review, and if the evidence changed, it comes back up. A cancelled standing order just sits there, cancelled, waiting for a feeling that has to be at least as strong as the one that stopped it. Those two mistakes are not the same size.
What I'd actually put in the assumption box this year
Use a band. Run the plan at the pessimistic end and the optimistic end and read both dates, then live somewhere between them. If your single number sits above every published forecast in the previous section, that isn't a plan, it's a wish with a spreadsheet around it.
Deflate on purpose. If your plan works in today's money you need a real return, so subtract an inflation assumption and write down which one you used. Robeco publish 2.50% for the euro area and 2.75% for the US. Long-run US inflation since 1900 is 2.9%. Pick one and say so, rather than leaving a 7% floating with no unit attached.
Then look at what you actually own instead of what the headline is about. MSCI World, as of the end of July, is 72.03% United States, 28.87% information technology, and its top ten holdings are 26.41% of it. If your worry is American AI concentration, "I hold a global fund" is not the reassurance you think it is, and I say that as someone who held that belief until I read my own factsheet. The full version of that unpleasant surprise is here.
And put the review on a date rather than on a mood. Ours lands in January and takes about an hour, my wife and a coffee included. The review is allowed to change the assumption, the date, and the required contribution. It is not allowed to vote on whether the transfer exists.
Three moves that feel clever at CAPE 41
Waiting for the dip. The dip arrives wearing a costume. It shows up as "banks under stress" or "AI capex finally rolled over," and at that moment buying feels insane rather than obvious, which is the entire reason the discount exists. I already lost six weeks to this in the spring with a lump of cash I was too clever to deploy, and I wrote down what those six weeks cost so I'd stop repeating it.
Rotating into whatever just won. In 2026 this mostly meant buying US mega-cap AI, at which point MSCI Emerging Markets returned +20.27% year to date against MSCI World's +10.52%. The person who did something decisive largely did the wrong decisive thing, on time.
Adding funds until it looks like a strategy. Five funds instead of one doesn't reduce your exposure to global equity — it reduces your ability to see it. I know exactly one period when I had a real market opinion, and it started as a lucky stock pick and ended as a crypto invoice, so I treat the urge to complicate as a symptom rather than a plan.
The strongest case against me
Vanguard, on the same page that supplies my forecast numbers, says valuations "should not serve as a primary reason for changing portfolio allocations." A hostile reader can point out that I'm doing exactly that, one step removed.
Here's the distinction I have to defend. I'm not changing the allocation. I'm not changing the contribution. I'm changing a planning input whose only output is a date. If you read this and end up trading on your new assumption, I've failed and you should ignore me.
Second, I can't lean on the behaviour evidence the way I'd like to. The obvious argument for not running a valuation rule is "I'd abandon it," and the obvious number to reach for is Morningstar's 1.2-point investor return gap. Except a peer-reviewed paper in the Financial Analysts Journal in May 2026 re-ran Morningstar's own sample and put the cost of bad timing at 0.10% a year. That's roughly twelve times smaller, and I'd rather concede it than quote a number I know is under attack. So the argument has to be about me rather than about the crowd: a rule that requires me to stay underweight for years while I look wrong to myself is a rule I would quit, and I have the receipts to prove it.
Third, and this is the real boundary of everything above. I'm accumulating. Expecting less and moving my date costs me almost nothing, because I have decades of contributions to absorb the error. Someone five years from their number has a completely different problem: the same valuation signal that argues for a later date also argues for a genuinely different equity weight in the fragile decade around the finish line. That's an allocation question, and "keep the transfer, edit the spreadsheet" is not sufficient advice for it. If that's you, go read about sequence-of-returns risk instead and treat this article as background reading.
The last objection is the sharpest: if valuation tells you almost nothing over a year, and the CAPE-above-30 evidence is two events, what licenses moving 7% to 4%? Both responses answer the same weak signal. One just feels more sophisticated.
My answer isn't that I forecast better. It's that the two errors cost different amounts. Lower your assumption and get it wrong, and you arrive early, and the annual review quietly corrects it. Pause your buying and get it wrong, and you permanently missed months at prices that don't come back, with nothing on the calendar to restart you. Asymmetric failure modes, not superior insight.
Investing at all-time highs again, on the first of next month
Same standing order. Same fund. Same day. I'll almost certainly still be investing at all-time highs, because roughly half the months of an investing life are within 5% of one, and pretending otherwise is a way of losing a decade to a mood.
Once a year I open the projection, edit one number, and read whatever date comes out. That's the whole ritual. The tool I use for it is the one I built for myself, which is obviously my own product, so weigh that accordingly. A spreadsheet does the same job. What matters is that the worry produces a date instead of a feeling, because a date is something you can plan around and a feeling is something you cancel a transfer over.
The CAPE print, the bubble op-ed, the central bank warning about a sharp correction: all of it is information about the assumption. None of it is an instruction about the transfer.
I'd rather be wrong about the date than absent from the decade.
Stay Updated
Get notified about new articles and MFFT build-in-public updates.
Ready to Apply This?
Start tracking your finances today and put these tips into practice.
- Import bank statements in seconds
- AI-powered categorization
- Beautiful visualizations
- Set and track financial goals
Related posts
 Learn To Invest
Increase Monthly Investment Every Year. I Didn't, and That Was a Pay Cut I Gave Myself.
A month ago I called my unchanged monthly ETF transfer a sign of discipline. It is a pay cut. A contribution frozen since 2020 buys about 22% less, and a 10% savings rate drifts to under 8% with nobody deciding anything. Automate the buy. Never automate the amount.
 Learn To Invest
Investing App Gamification: Check What Your Broker Earns
The confetti isn't the problem, the revenue model is. A ten-minute test of what your broker earns while you do nothing, and why Europe and the US differ.
 Learn To Invest
When to Sell Index Funds: Four Tests Before You Touch Them
Not on a price or a date. Sell index funds only when one of four written-down tests is met, and keep a never-list for when panic poses as a plan.
 Learn To Invest
AI Investing Advice: Why ChatGPT Sells Conviction, Not Edge
Four in five young UK investors use AI for investing, and most know it can be wrong. One test for AI advice: does it remove decisions or manufacture them?
 Learn To Invest
How Does Compound Interest Work? (Formula + Examples)
Compound interest means growth earns growth. The formula in words, a year-by-year table, the rule of 72, and how the same math runs against you on debt.