Sequence of Returns Risk: The 2026 FIRE Defense Playbook

Two retirees, both 60. Both walk away from their jobs with exactly $1,000,000, plan to pull $50,000 a year inflation-adjusted, and over the next 30 years their portfolios earn the same average return — about 6.5%.
One of them dies a multimillionaire. The other runs out of money at age 87.
The only difference? The order in which the returns showed up. That, in a single sentence, is sequence of returns risk — and as of May 2026 it is the most dangerous, most underappreciated force in your retirement plan. The S&P 500 Shiller CAPE is sitting at 40.3 (top 5% of all time). April CPI just printed 3.8% YoY, the hottest since 2023. Kevin Warsh was confirmed Fed Chair on a 54-45 squeaker, the closest vote in modern Fed history. Morningstar quietly cut its 2026 safe withdrawal rate to 3.9%. And rate-hike odds for December are sitting between 30% and 47% depending on which prediction market you trust.
If you are anywhere inside the fragile decade — the five years before retirement through the five years after — this article is for you. I am going to do three things: make sequence risk concrete in hard dollar math, explain why mid-2026 is uniquely dangerous, and then hand you a five-layer defense playbook you can implement this weekend.
Let's start with the chart that makes everyone gasp.
The $1 Million Portfolio That Lived 30 Years vs Died in 27 — Same Returns, Different Order
Here is the example Fidelity has been quietly running in advisor decks all year, and that CNBC ran a version of in April. Two retirees. Both $1M. Both withdraw $50,000 in year one, inflation-adjusted at 2% every year after. Both earn the exact same set of annual returns over 30 years.
The only difference: Retiree A gets the good years first. Retiree B gets the same years in reverse.
| Year | Retiree A (good first) | Retiree B (bad first) |
|---|---|---|
| Start | $1,000,000 | $1,000,000 |
| Year 5 | $1,420,000 | $620,000 |
| Year 10 | $1,650,000 | $480,000 |
| Year 15 | $1,890,000 | $310,000 |
| Year 20 | $2,310,000 | $140,000 |
| Year 25 | $2,780,000 | $0 (depleted yr 27) |
| Year 30 | $3,200,000 | — |
(Both: $50K/yr withdrawal +2% inflation, identical 6.5% average annual return.)
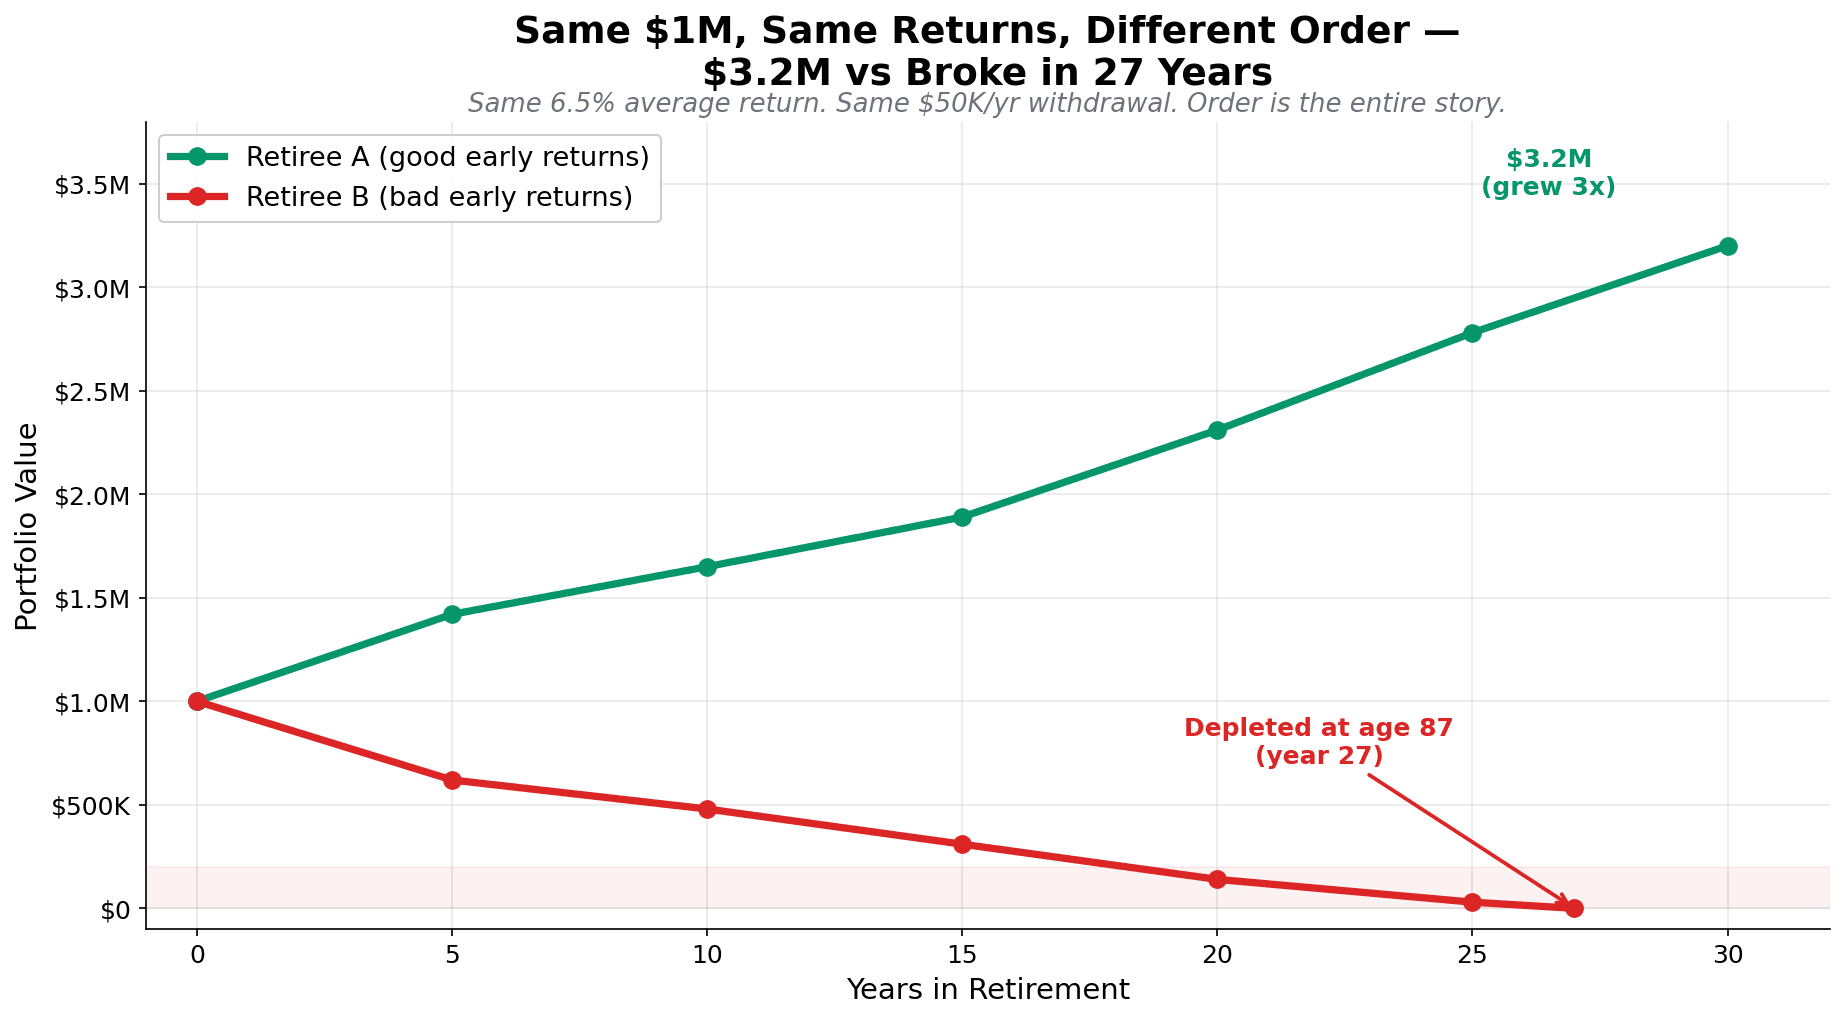
Take a second to let that sink in. Both retirees did the exact same things. They saved the same amount, retired with the same balance, spent the same money, and earned the same long-run average return. One ended up with $3.2 million in legacy wealth. The other was eating into Social Security at age 87.
The mechanism is brutally simple. When you are accumulating, a 30% drawdown is a buying opportunity — your monthly contributions buy more shares at lower prices. When you are withdrawing, that same 30% drawdown is a guillotine. You are now forced to sell shares at the bottom to pay rent, which means you sell more shares than your plan assumed, which means there are fewer shares left to participate in the recovery, which means the recovery never restores you to the path your spreadsheet projected.
Michael Kitces calls this the portfolio size effect. Big ERN (Karsten Jeske, the FIRE community's most rigorous SWR researcher) has shown that 77% of your final retirement outcome is explained by the average return of the first 10 years. Seventy-seven percent. Of a 30-year retirement. Determined by the first third.
That is sequence of returns risk in one sentence: what happens early matters dramatically more than what happens late. And right now, "early" is happening in 2026.
Why May 2026 Is the Most Dangerous Time in 20 Years to Hit Retirement
Stack up what is on the table this month:
- CAPE 40.3. The Shiller cyclically adjusted P/E is sitting in the top 5% of all readings since 1881. The 1929 peak was around 30. The dot-com peak was 44.2. We are closer to the dot-com top than to historical fair value.
- April CPI 3.8% YoY. The hottest print since May 2023, with energy +17.9% YoY and gasoline +28.4%. Core is +2.8%, still well above the Fed's 2% target.
- Warsh confirmed 54-45. The closest Fed Chair vote in modern history. His first FOMC meeting is June 16-17 and markets genuinely do not know whether he tilts hawkish (his historical posture) or caves to political pressure for cuts.
- Rate-hike odds 30-47%. Kalshi has the next move as a hike by July 2027 at 47%. JP Morgan now forecasts a Q3 2027 hike. BofA sees the Fed on hold all of 2026.
- Morningstar SWR 3.9%. Down from 4.0% the cycle before, and 3.7% for a 50/50 portfolio. Christine Benz's team explicitly cites elevated equity valuations as the reason.
- Real wages -0.3% YoY. Nominal wage growth is finally getting eaten by inflation again.
Here is the snapshot, all in one table:
| Metric | Reading | What It Means |
|---|---|---|
| S&P 500 CAPE | 40.3 | Top 5% of all-time |
| 10Y Treasury yield | 4.48% | Above 20-yr average |
| 10Y TIPS real yield | 1.98% | Bonds finally productive |
| April 2026 CPI | 3.8% YoY | Highest since May 2023 |
| Fed funds rate | 4.25-4.50% | Warsh's first meeting June 16-17 |
| Rate-hike odds (Dec 2026) | 30-47% | Markets pricing real risk |
| Vanguard 10Y stock forecast | 4.9% nominal / 2.7% real | Below historical average |
| Shiller 10Y forecast | 1.3% total return | Most pessimistic in 25 years |
| Morningstar 2026 SWR | 3.9% (30-yr base) | Down from 4.0% |
| Bengen 2025 SAFEMAX | 4.7% (30-yr) | Up, but assumes CAPE/CPI aren't BOTH high |
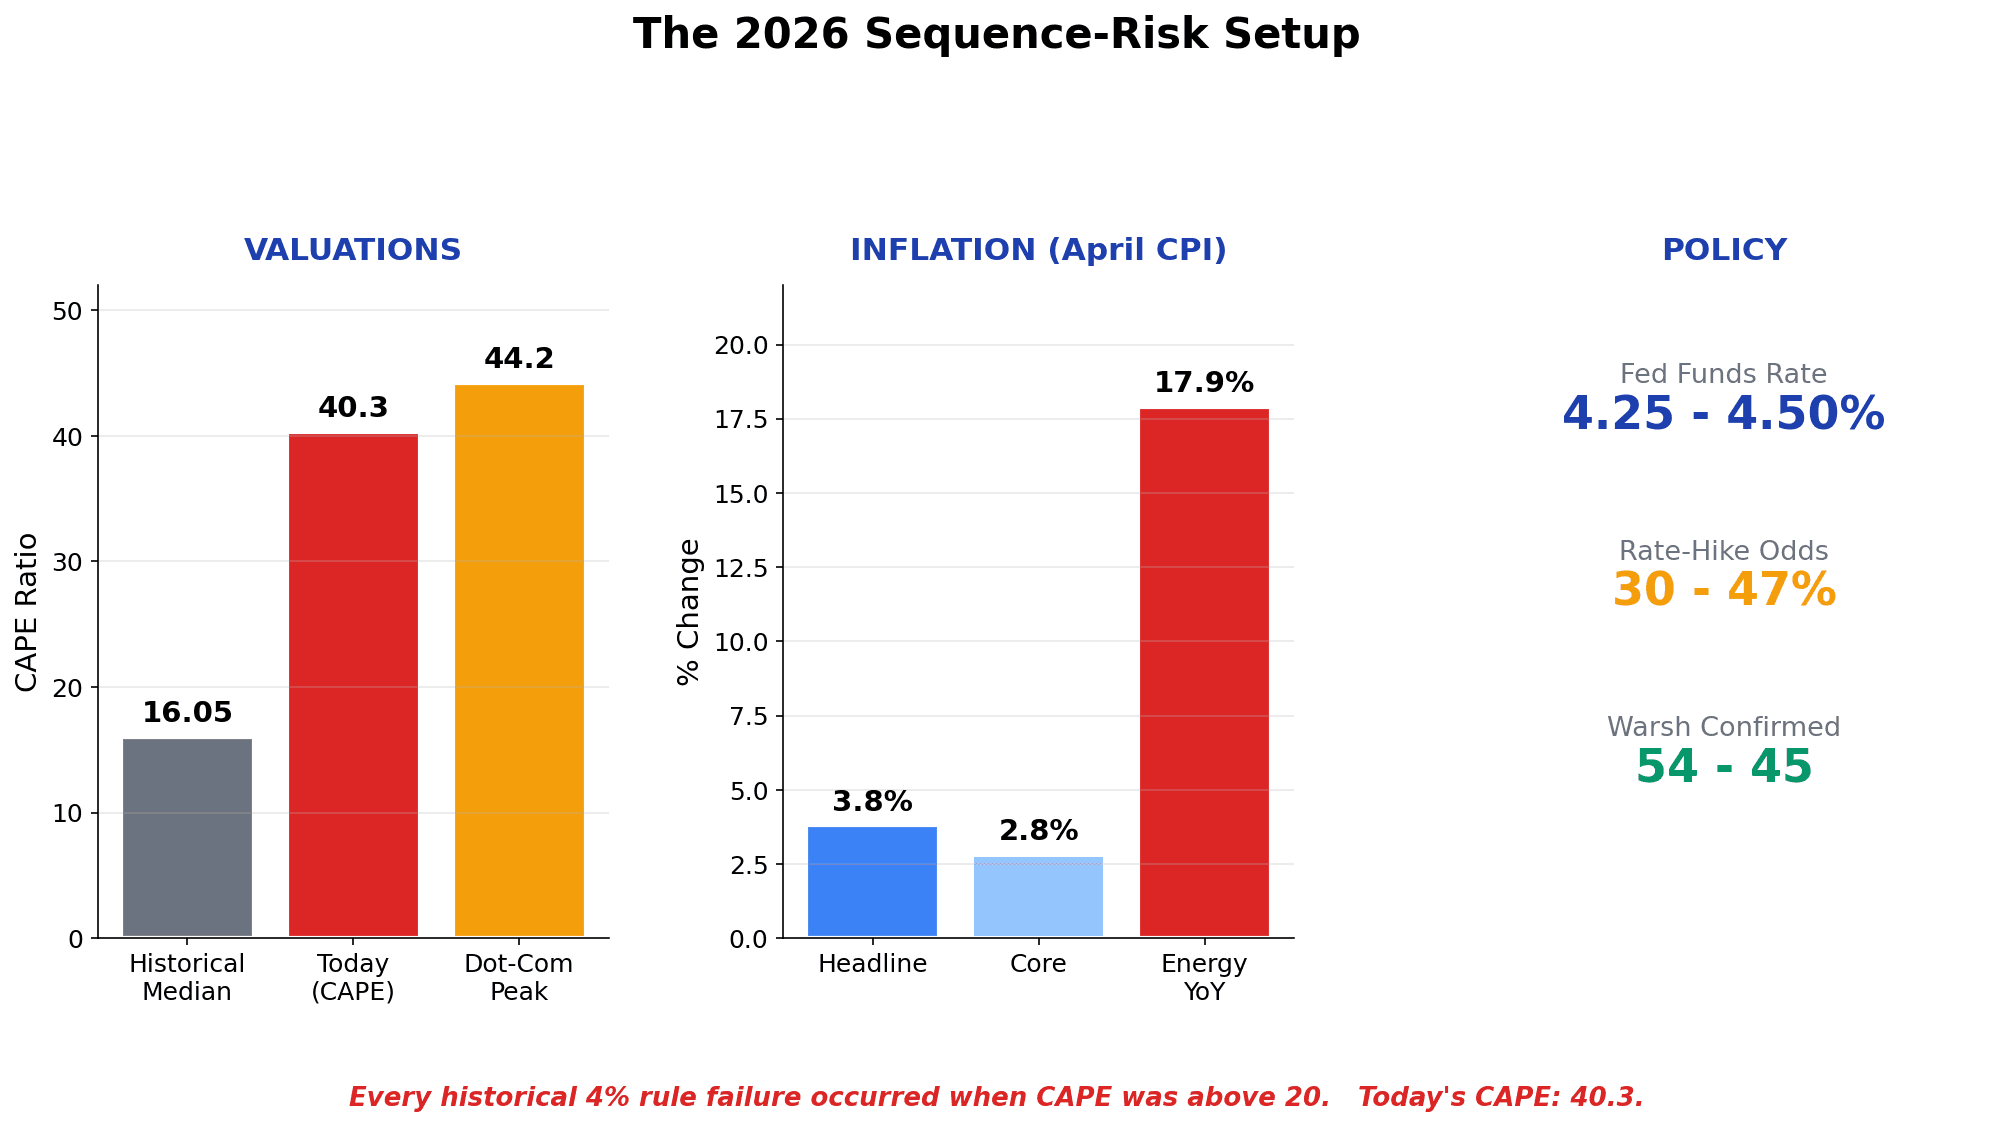
Why does this combination matter so much? Because every historical failure of the 4% rule occurred when starting CAPE was above 20 (Kitces, Bogleheads research). Today's reading is 40 — exactly double. Kitces's data shows the correlation between starting CAPE and the eventual safe withdrawal rate is roughly -0.74. Big ERN finds an even stronger 0.77 correlation between CAPE earnings yield and SWR. And when you layer high CAPE plus elevated inflation — which is exactly the 1966 setup that originally drove Bengen to derive the 4% rule as the SAFEMAX — the historical track record gets ugly fast.
The 1966 retiree pulled 4% inflation-adjusted from a 60/40 portfolio. Despite catching the massive 1982-2000 bull market in years 17-34, the portfolio was depleted by year 22. Stagflation and double-digit inflation in the early withdrawal years destroyed real returns and the recovery came too late.
The 1982 retiree, just 16 years later, ran the identical strategy and finished with multiples of starting wealth. The difference was not skill, not asset allocation, not discipline. It was when they happened to be born.
Today, the macro setup rhymes with 1966 (stagflation pressure) and 2000 (peak valuations on the eve of a tightening cycle). That is two of the three worst sequences in 100 years of US market history at once. If you are inside the fragile decade right now, this is your problem.
Why FIRE Retirees Face 3x the Sequence Risk of Normal Retirees
Most sequence-risk articles use a 30-year retirement horizon. That is the right horizon for a 65-year-old. It is the wrong horizon for you, if you are aiming for FIRE.
A 45-year-old retiree planning to live to 95 is not running a 30-year retirement. She is running a 50-year retirement. And the math at 50 years is materially worse than at 30.
Here is what the data actually shows when you push the horizon out:
| Withdrawal Rate | 30-yr Success (Trinity) | 50-yr Success (FIRE) |
|---|---|---|
| 3.0% | ~100% | ~95% |
| 3.5% | ~99% | ~92% |
| 4.0% | 95-96% | ~90% |
| 4.5% | 85% (100% stocks) | ~75% |
| 5.0% | 85% (50/50) | ~60% |
| 5.5% | 70% | ~45% |
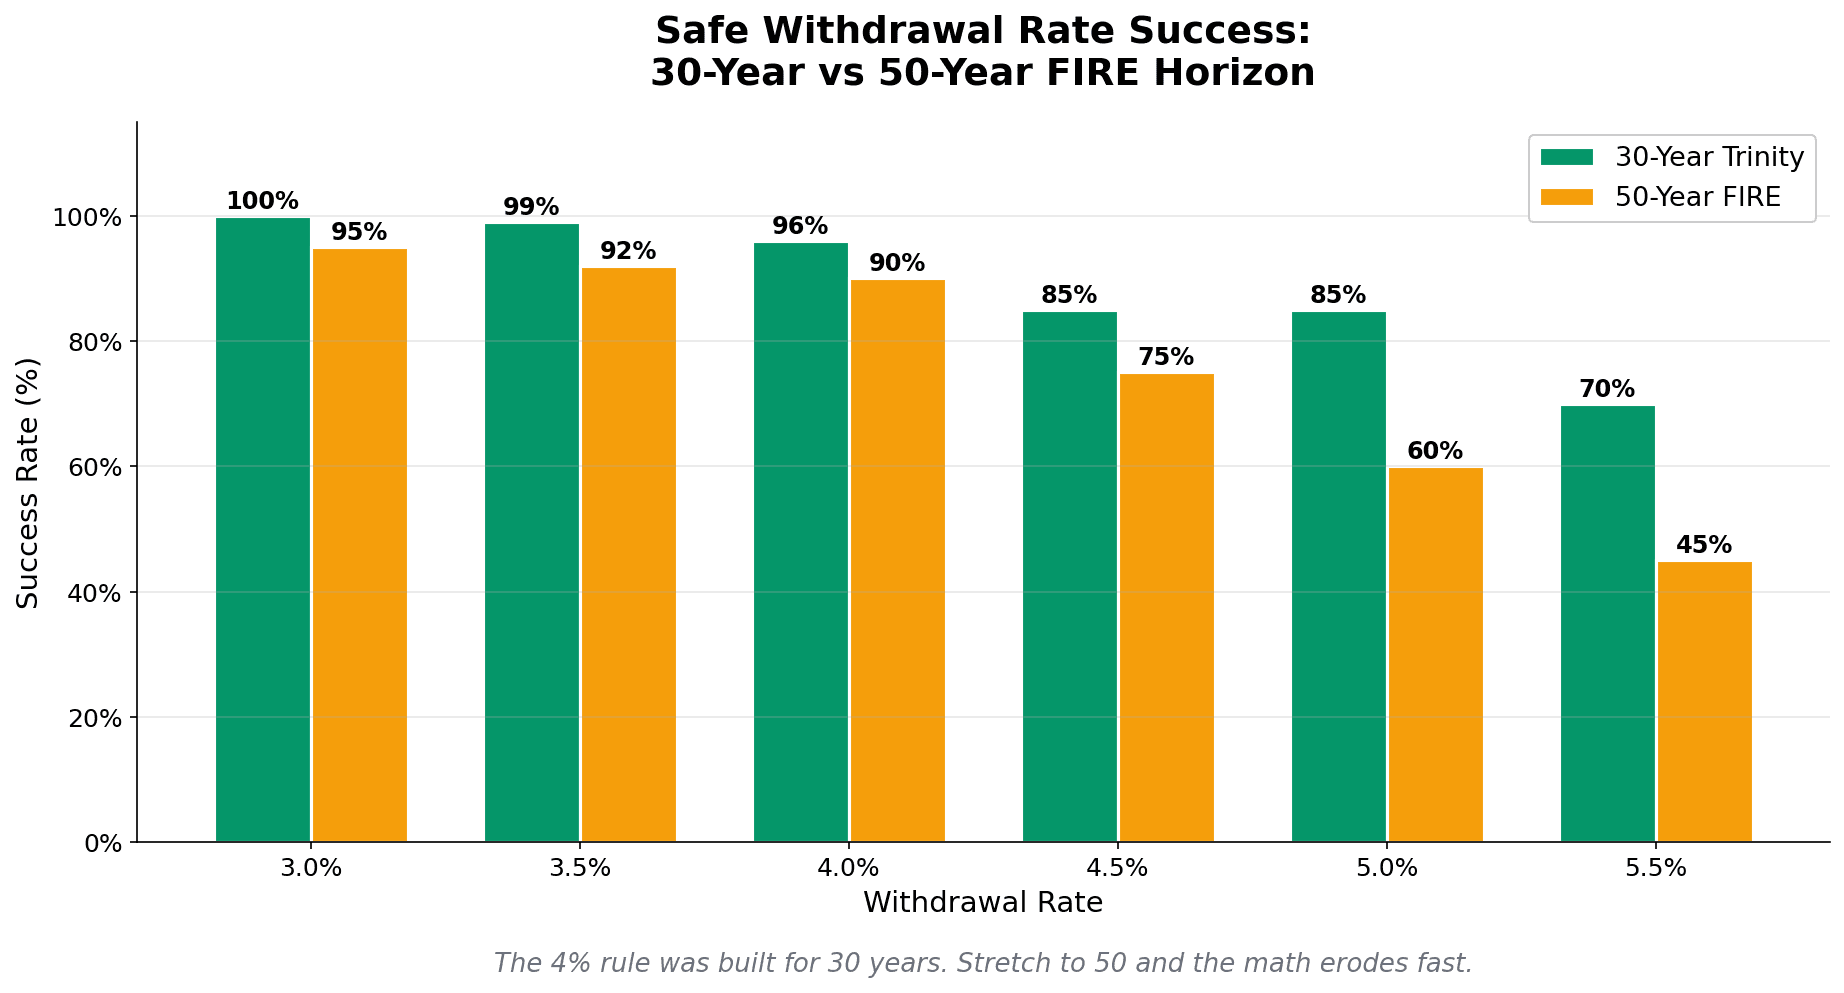
Notice what happens at 4.0%. The classic Trinity result is 95-96% success at 30 years — call it bulletproof. At 50 years, the same withdrawal rate sags to roughly 90% success. That is still decent in isolation, but it ignores starting conditions. Apply CAPE 40 to the same withdrawal rate using Kitces's CAPE-adjusted framework and the picture darkens further:
| Starting CAPE | 30-yr SWR | 50-yr FIRE SWR |
|---|---|---|
| Under 15 (cheap) | 5.5% | 4.5% |
| 15-20 | 5.0% | 4.0% |
| 20-25 | 4.5% | 3.7% |
| 25-30 | 4.0% | 3.3% |
| 30-35 | 3.7% | 3.1% |
| 35-40 | 3.5% | 2.9% |
| 40+ (TODAY) | 3.3% | 2.7% |
That last row is the one that should stop you. At today's valuations, the CAPE-adjusted safe withdrawal rate for a 50-year FIRE retirement is roughly 2.7%. That means $1 million supports $27,000 a year — not $40,000.
Bill Bengen himself nudged his SAFEMAX up to 4.7% in 2025, but with two explicit caveats: it assumes a broadly diversified 55% stocks / 40% bonds / 5% T-bills portfolio, and it assumes you are not retiring into a combined high-CAPE-plus-high-inflation regime. That is precisely the regime we are in. So while Bengen is more optimistic on paper, even he agrees the current setup invites caution.
This is why BaristaFIRE and CoastFIRE are not just lifestyle preferences — they are sequence-risk hedges by design. Any part-time income that covers 30-50% of your expenses drops your effective withdrawal rate from 4% to 2%, which moves you from the danger zone to the safe zone almost regardless of what the market does. If you have not thought about this angle yet, I unpack it in Time Freedom Over Retirement: Why the FIRE Community is Redefining Success.
The good news: you do not have to retire on 2.7%. The five-layer playbook below pushes the safe rate back up into the 4-5% range even in 2026's environment. Here is how.
The Five Defense Layers Every FIRE Plan Needs in 2026
Before we dive into each layer, here is the framework in one chart. No single layer fixes sequence risk. Stacked together, they push the safe rate from a panicky 3.0% back up toward 4.5-5.0% with high confidence.
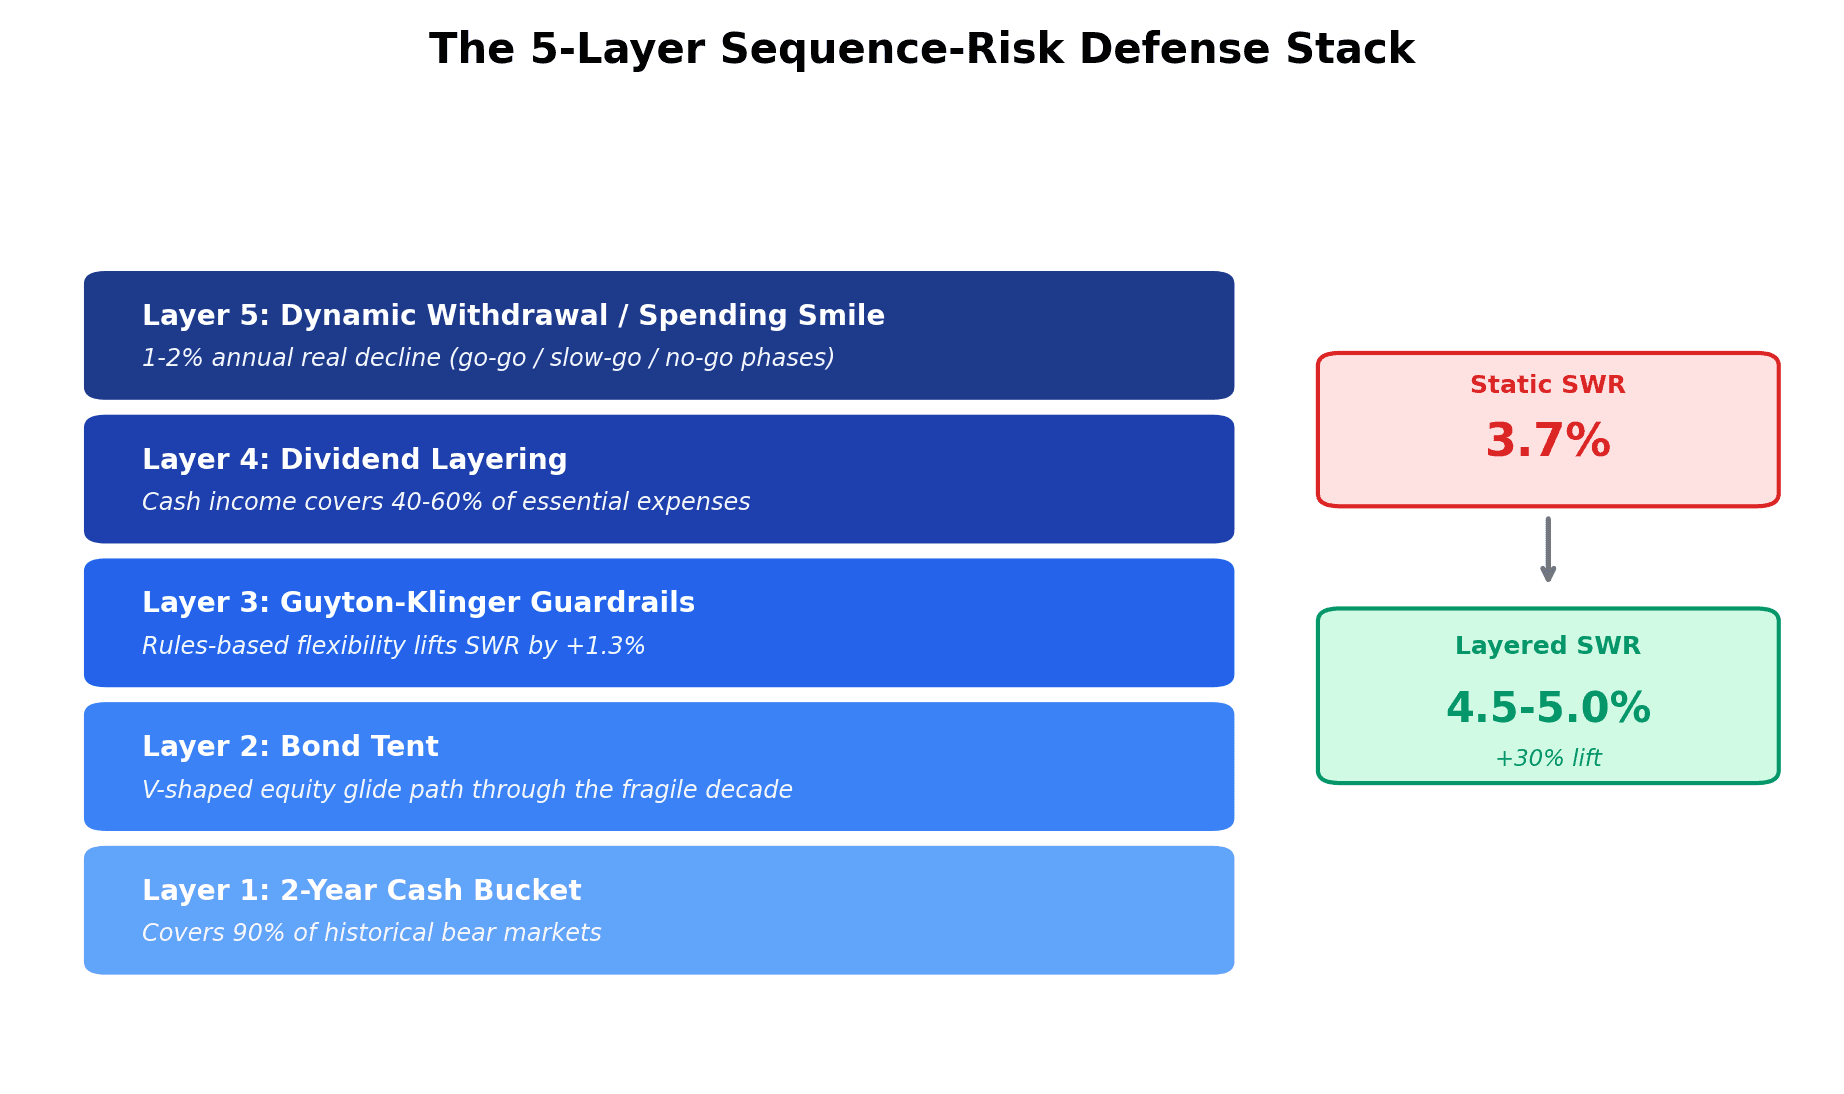
The five layers are:
- Two-year cash bucket — covers ~90% of historical bear markets with zero forced selling.
- Bond tent — a V-shaped equity glide path that goes defensive in the fragile decade and re-aggressive after.
- Guyton-Klinger guardrails — rules-based flexibility that lets you start higher because you pre-committed to cutting if breached.
- Dividend layering — 40-60% of expenses covered by cash dividends so you never have to sell at the bottom.
- Dynamic withdrawal / spending smile — real retirees naturally decline spending 1-2% per year in real terms.
Each is a real defense on its own. Together they multiply, because they work against different parts of the sequence-risk problem (forced selling, allocation drag, behavioral panic, cash flow timing, and lifestyle rigidity).
Let's break them down.
Layer 1 & 2: The Two-Year Cash Bucket and Bond Tent
Why 2 years, not 6 months and not 5
The math on the cash bucket is unintuitive. Most retirees instinctively reach for "6 months of expenses" (the classic emergency fund) or "5 years of expenses" (which feels safer but is actually worse).
The right number is 2 years, and the data is clear on why:
- The average S&P 500 bear market lasts 9.6 months (Invesco). Two years covers it with 14 months to spare.
- Even recessionary bear markets average 27 months from peak to recovery (Hartford Funds). Two years covers the bear itself; the third year is the recovery and you can sell into rising prices.
- A 24-month cash sleeve at today's 5% T-bill yield costs only 0.1-0.3% of long-run portfolio return vs a fully invested benchmark (Kitces). The drag is real but small.
- Stretch the bucket to 5 years and the drag compounds to 0.6-1.0% per year over 30 years — which can knock 10-20% off your terminal wealth.
So: 24 months of expenses, held in some combination of T-bills, money market funds, short Treasuries, and a savings ladder — a CD ladder built before the Fed's next cuts is a clean way to lock the yield on the second year of the bucket. At today's yields you can earn ~4.5-5% on the whole stack with effectively zero duration risk.
If your annual spend is $60,000, your cash bucket target is $120,000. If it's $80,000, you need $160,000. That number, separate from your equity portfolio, is what lets you weather a 2000-style two-year drawdown without selling a single share.
The bond tent: glide down, then back up
The second layer is the bond tent, or "rising equity glide path" — a framework developed by Wade Pfau and Michael Kitces. The idea is counterintuitive: equity exposure should drop into retirement and then rise again afterward. Visually, your allocation curve looks like an inverted V — or a tent.
Here is a concrete glide path for a couple retiring in 2031:
| Years from Retirement | Stocks % | Bonds % | Cash % |
|---|---|---|---|
| -10 | 90% | 10% | 0% |
| -5 | 80% | 18% | 2% |
| -2 | 70% | 25% | 5% |
| 0 (retire) | 60% | 30% | 10% |
| +5 | 65% | 28% | 7% |
| +10 | 75% | 20% | 5% |
| +20 | 70% | 25% | 5% |
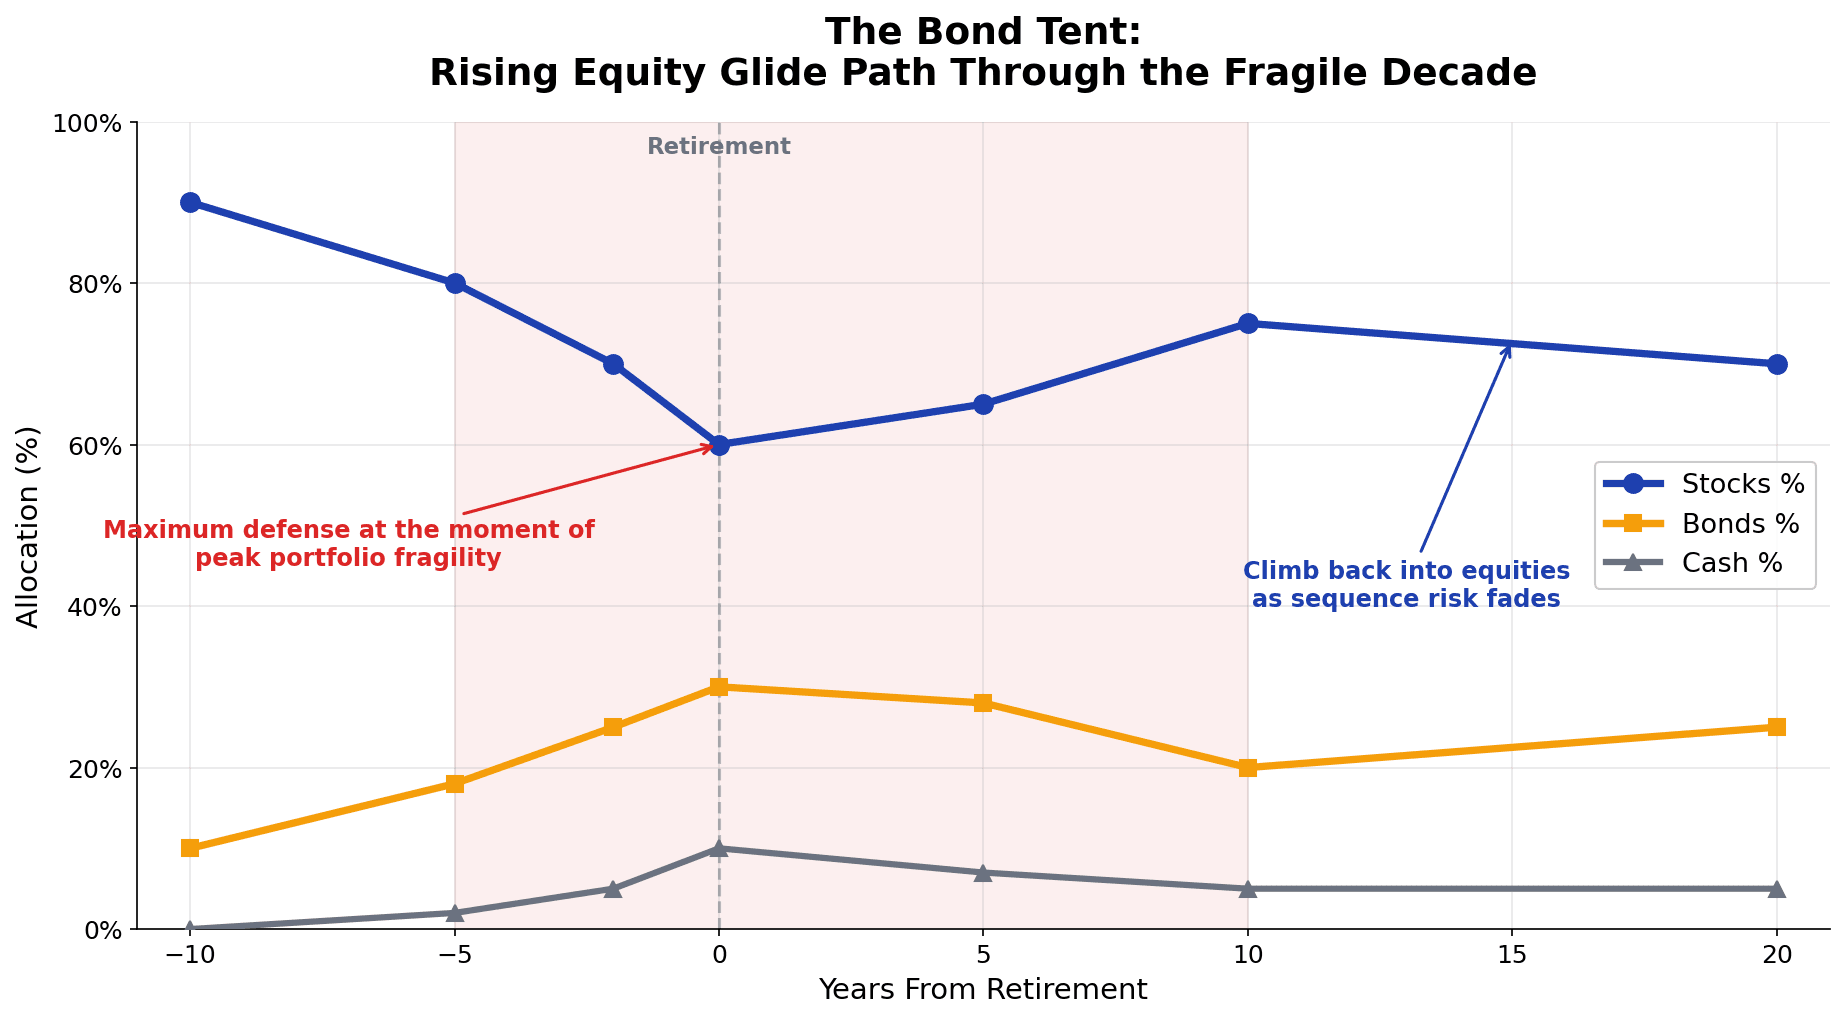
Why this shape? Because the moment of maximum portfolio fragility is the day you retire — that is when you have the most dollars at risk and the longest withdrawal horizon ahead of you. Five years either side of that moment is the fragile decade. Pfau-Kitces research shows this V-shaped allocation reduces both the probability and magnitude of failure compared to either a static 60/40 or a traditional "stocks decline with age" glide path.
The 2026 wrinkle is that bonds are finally productive again. With 10Y Treasury at 4.48% and 10Y TIPS real yield at 1.98%, the opportunity cost of going defensive is far lower than it was during the 2020-2022 zero-rate era. Pfau himself flagged this as a major tailwind: bonds carrying their weight makes the entire bond-tent strategy work mathematically in a way it barely did three years ago.
Practical move: if you are 5 years from retirement and still 90/10, you are over-exposed for the fragile decade. Start gliding now. The MFFT portfolio analysis tool will show you, at a glance, where your allocation actually sits — most savers think they're "60/40" and are actually 78/22 once you include their employer match's company stock and their HSA's target-date fund.
Layer 3 & 4: Guyton-Klinger Guardrails and Dividend Layering
Guardrails: rules-based flexibility
The static 4% rule has a hidden assumption: it withdraws the same inflation-adjusted dollar amount every year, regardless of how the portfolio is doing. That is the cleanest failure mode — withdrawing the same fixed real amount during a 50% drawdown is what sinks the 1966 retiree.
Jonathan Guyton and William Klinger published a brilliant fix in 2006: pre-commit to four decision rules that let you start higher because you have already signed up for the discipline of cutting when needed.
The four rules:
- Inflation rule. Take a CPI raise every year except after a year when the portfolio lost money and the current withdrawal rate exceeds the initial rate. (You don't reward yourself in a down year.)
- Cap rule. No annual inflation raise exceeds 6%, even if CPI is higher.
- Capital preservation rule. If the current withdrawal rate climbs more than 20% above your initial rate, cut withdrawals by 10% the following year.
- Prosperity rule. If the current withdrawal rate drops more than 20% below your initial rate, raise withdrawals by 10% the following year.
That bandwidth — the ±20% "guardrail" — is the entire mechanism. You start at, say, 5.0% of the portfolio rather than 3.7%. If markets cooperate, the rate stays within the guardrails and your spending mostly tracks inflation. If markets crash, the rate breaches the upper guardrail and you cut 10% — painful but survivable. If markets boom, you breach the lower rail and raise 10% — that is the "prosperity rule" most retirees forget about.
The data is striking: Guyton-Klinger guardrails support a 5.2-5.6% starting withdrawal at 99% historical success (Actuaplan, Morningstar). Morningstar's 2026 update shows the guardrails approach gives a 5.2% starting rate for a 40/60 portfolio — almost 1.3 percentage points higher than the static SWR.
In dollar terms on a $1M portfolio, that is $52,000/year vs $39,000/year. A 33% pay raise just for committing to a rule.
The catch: you have to actually be able to cut spending 10% when the rule triggers. In a Great Depression scenario the cumulative cuts can hit 40%+ in real terms. Mortgages, healthcare, and family obligations make 30%+ cuts physically hard. So the guardrails are more like "rules-based flexibility up to a point" — they work if your budget has discretionary slack. This is exactly why MFFT's budgeting tool matters more in retirement than in accumulation: you cannot cut what you cannot see.
One more wrinkle worth flagging: when the guardrails say cut, you want to cut from the most tax-efficient bucket. That is where the Roth Conversion Ladder you built years ago becomes invaluable — pulling matured Roth principal during a guardrail-triggered cut means the gross withdrawal is smaller than the net income, because you owe zero federal tax on it.
Dividend layering: cash flow that doesn't require selling
Layer 4 attacks sequence risk from a different angle: what if you didn't have to sell shares at all during the fragile decade?
That is the dividend layering thesis. Build a deliberate dividend tilt — Dividend Aristocrats for reliability, monthly payers like Realty Income (O), STAG, Main Street Capital (MAIN), and covered-call ETFs like JEPI/JEPQ for cash flow frequency — to cover 40-60% of your annual expenses with cash income.
The math: if you spend $60,000/year and your dividend portfolio throws off $30,000 of cash income, you are covered for half your spend before you sell anything. Combine that with the two-year cash bucket and your forced-selling exposure is dramatically lower than the headline 4% withdrawal rate implies.
Now — Big ERN's important counter: dividends are not magic. In 2008-2009 S&P 500 dividend cuts averaged 23%. In 2020, 100+ S&P 500 names cut or suspended dividends. So a 100% dividend strategy ("yield shield") is genuinely fragile in a real crash. The right framing is layering: dividends are one cash-flow source among several, sized so that a 30% dividend cut still leaves you with cash bucket + bonds + Guyton-Klinger flexibility to absorb the gap.
If you want the full build — exactly which Aristocrats, which monthly payers, which covered-call ETFs, and how to integrate with your taxable vs Roth accounts — I worked through it in detail in Monthly Dividend Income Strategy: Build Predictable Cash Flow for FIRE in 2026. The dividend layer is the most narratively satisfying defense against sequence of returns risk because you actually see the cash hit your account every month.
Layer 5: Dynamic Withdrawal — The "Spending Smile" for Survivors
Here is the layer almost every FIRE article ignores: real retirees don't actually spend the same amount in real terms every year.
David Blanchett (formerly Morningstar, now PGIM) published the foundational research: retirement spending follows a smile shape. High in the go-go years (active travel, hobbies, helping kids), declining 1-2% real per year through the slow-go years (less travel, less eating out), then drifting up modestly in the no-go years (healthcare). On net, the average retiree's real spending declines roughly 25% over 30 years.
Here is what that curve looks like indexed to 100 at retirement:
| Retirement Year | Real Spending Index |
|---|---|
| 1 | 100 |
| 5 | 95 |
| 10 | 88 |
| 15 | 82 |
| 20 | 78 |
| 25 | 80 (healthcare bump) |
| 30 | 85 |
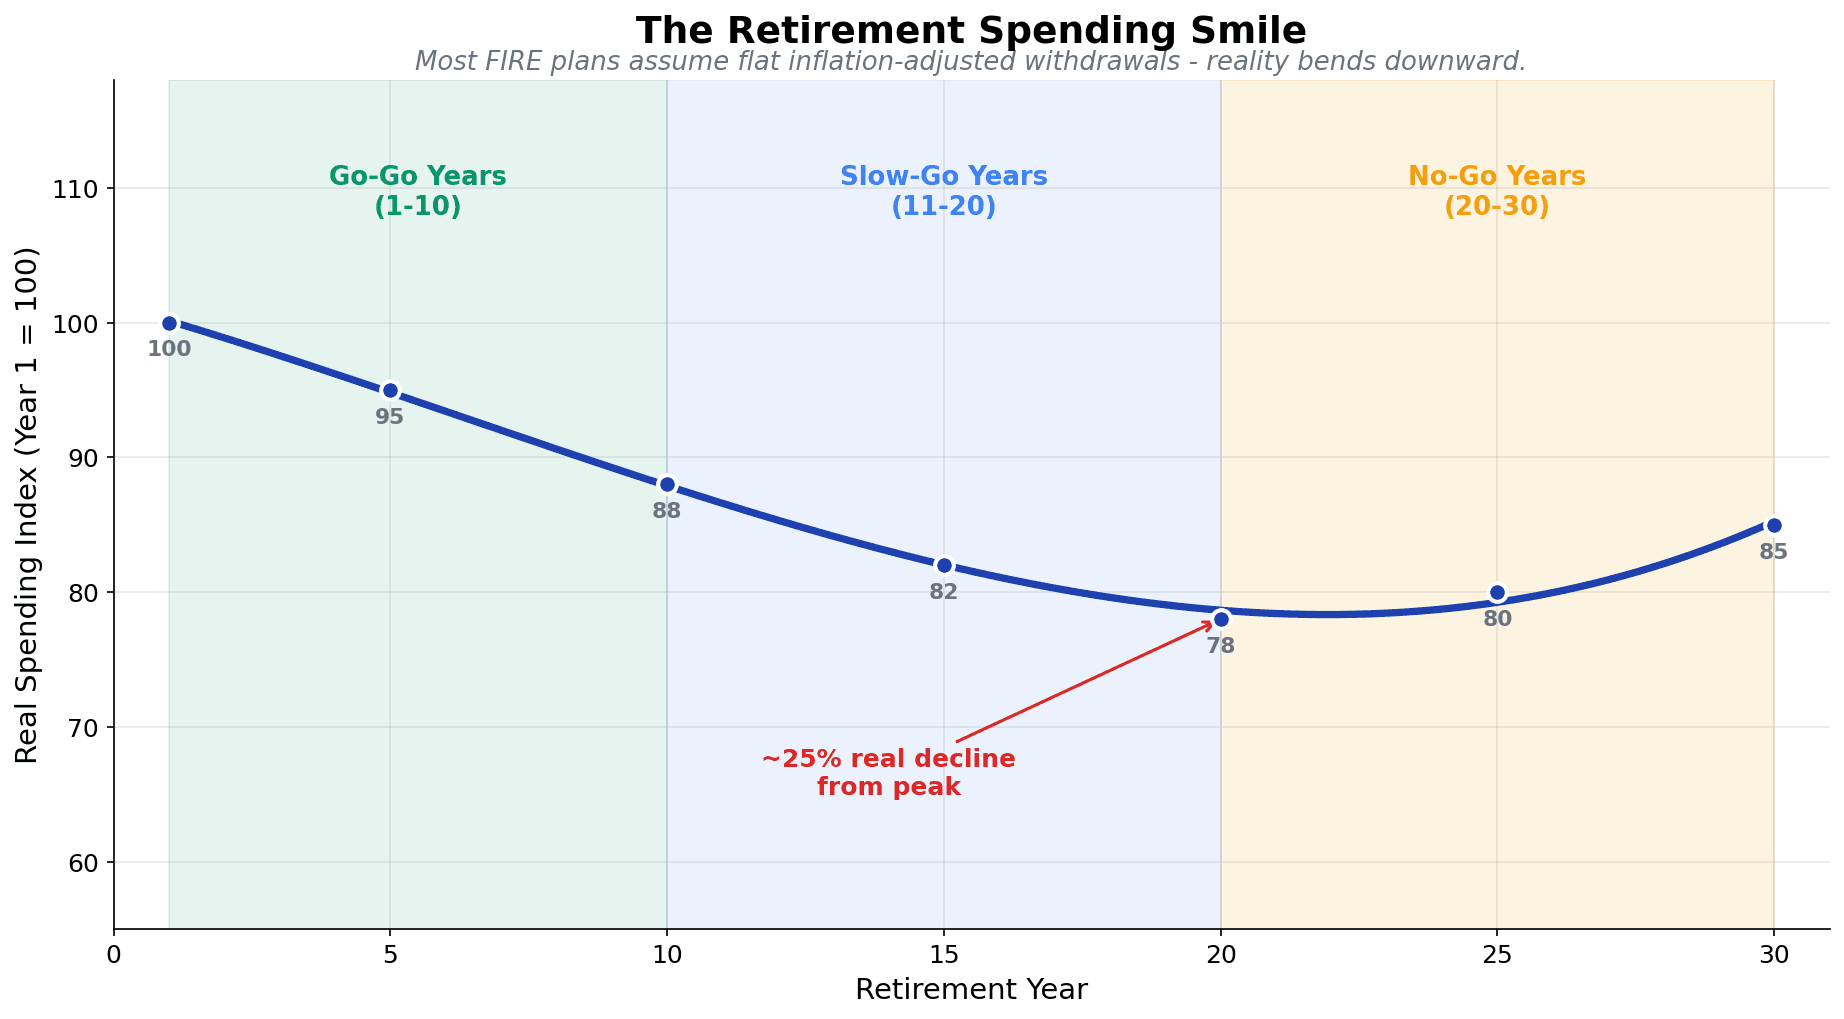
Why does this matter so much for sequence risk? Because the static 4% rule assumes you will withdraw $40,000 real every single year for 30 years. The spending smile says the honest withdrawal pattern is closer to $40K, $40K, $38K, $36K, $34K, $32K. That is a 20% lower lifetime spend than your spreadsheet models — which translates directly into a meaningfully higher safe starting withdrawal rate.
Vanguard's research on dynamic spending closes the loop: a "percent of portfolio" approach with a 5% ceiling and -2.5% floor produces >85% portfolio survival over 35 years for a 60/40 portfolio. Applied to FIRE retirees, dynamic spending lifts 50-year success from 56% to 90%. Read that again: 56% to 90%. Same portfolio, same asset allocation, same expected return — just by allowing spending to flex with the market.
The other side of this coin is psychologically harder than it sounds. The spending smile is not just permission to cut in bad years — it is also permission to spend MORE in good years. Most FIRE retirees, having spent a decade or two in extreme savings mode, structurally underspend in retirement. They die rich and miss the years when their bodies could enjoy the wealth. This is the bridge between sequence-risk discipline and the broader "are you actually living?" question I went deep on in Die With Zero vs FIRE: The Retirement Spending Paradox Stealing Your Best Years.
Stack all five layers and the picture transforms. Where the static safe withdrawal rate is 3.7% in 2026, the layered approach gets you to:
- 2-year cash bucket: removes 90% of forced-selling risk
- Bond tent: cuts magnitude of failure ~30%
- Guyton-Klinger: lifts SWR by ~1.3 percentage points
- Dividend layering: another ~20% reduction in selling pressure
- Dynamic withdrawal: lifts success rate from 56% to 90% for FIRE horizons
The combined safe withdrawal rate sits comfortably in the 4.5-5.0% range with high confidence, even at CAPE 40. That is the difference between $37,000 a year and $50,000 a year on a $1M portfolio — meaningful enough to change whether you actually retire.
Stress-Testing Your Own Plan: A 30-Minute MFFT Workflow
Reading about sequence risk in the abstract is one thing. Watching your own plan break is another. Here is the 30-minute workflow I use with anyone who emails me about this:
Step 1 (5 min): Audit what you actually own. Most people who think they are "60/40" are actually 70/30 or 80/20 once you account for employer stock, target-date funds, HSA allocations, and cash drag. The MFFT Portfolio Analysis Breakdown Tool X-rays every account, rolls up your true allocation, and shows you whether you're already inside the bond tent or still in accumulation posture. Before you can apply any glide path, you need to know where you actually stand.
Step 2 (5 min): Calculate your fragile-decade exposure. Count the years from today to your target retirement date plus five. That is your fragile decade window. If you are 50 and retiring at 55, your fragile decade runs from 2026 to 2036. Everything you do between now and 2036 matters more for sequence risk than everything you do afterward.
Step 3 (10 min): Model the shock. Pull your current portfolio number into a spreadsheet (or MFFT's net worth tracker). Apply a 30% haircut to the equity portion. Apply your annual withdrawal. Project five years of $0 nominal returns (a realistic stagflation scenario). Where does the portfolio sit at year 5? If it's still >70% of starting value, you're robust. If it's below 50%, you are exposed.
Step 4 (5 min): Identify your weakest layer. Look at the five-layer stack: do you have 24 months of cash? Are you gliding toward the right allocation? Have you written down your guardrail rules? Are dividends covering any meaningful slice of expenses? Have you built any spending flexibility into your budget? Most pre-retirees are weak on two or three of these.
Step 5 (5 min): Pick your first 30-day fix. Don't try to build all five layers at once. Pick the weakest one and commit to building it in the next 30 days. For most people that is the cash bucket — it is the easiest to execute, gives the fastest psychological win, and removes the most forced-selling risk.
If the spreadsheet feels intimidating, that is exactly what the MFFT tools are for. Tracking net worth month over month makes the guardrail trigger visible before you hit it. Categorizing your accounts as Taxable / Traditional / Roth makes the withdrawal-sequencing question concrete. Watching the dividend column grow as you tilt toward income payers makes Layer 4 feel real. The math itself is straightforward — what the tools do is make the buckets visible, which is what 95% of pre-retirees never bother to do.
The 90-Day Sequence-Risk-Proofing Action Plan
Let me close with the punch list. Three months. Five layers. Real moves.
Days 1-30: Build the cash buffer.
- Calculate your annual spend (use last 12 months' bank/credit card totals — be honest).
- Multiply by 2. That is your cash bucket target.
- Open a Treasury Direct or brokerage account if you don't have one for short-term cash.
- Build a T-bill or short Treasury ladder to fill the bucket. At today's yields you can earn ~4.5-5% on the entire stack.
- If you can't fill the bucket in 30 days because the cash isn't there, set the build-up rate: how many months of expenses can you add per quarter from cash flow? Document it.
Days 31-60: Set the glide path and write the guardrails.
- Use the portfolio analysis tool to find your actual current allocation.
- Draw your bond tent for the years between now and 5 years post-retirement. Decide your retirement-date allocation (60/30/10 is a reasonable default for most).
- Calculate the annual rebalance step: ("Current stock %" minus "Target stock %") divided by years remaining = annual reduction in equity exposure.
- Write down your Guyton-Klinger guardrails on one page: initial withdrawal rate, upper rail, lower rail, what you will cut from first.
- Decide who will actually pull the trigger on the guardrail in a real crash. Spouse veto? Email yourself? Pre-write it.
Days 61-90: Add the dividend tilt and document the withdrawal sequence.
- Decide what percentage of your equity sleeve will tilt toward dividend-payers. 25-40% is the typical range.
- Pick your tier-1 holdings (Aristocrats), tier-2 (monthly payers), tier-3 (covered-call ETFs). The full build is in Monthly Dividend Income Strategy: Build Predictable Cash Flow for FIRE in 2026.
- Write a one-page withdrawal sequence: "In a normal year, pull from X. In a guardrail-cut year, pull from Y. In a tax-spike year, pull from Z."
- Layer in the spending smile: project a 1-1.5% real spending decline year-over-year into your retirement model and see what the math allows.
- Build the dashboard. Whatever tool you use, the test is: can you see all five layers at a glance, monthly? If yes, you're done. If not, that is your weekend project.
Ninety days from today, if you do this work, your plan is no longer one bear market away from broken. Your safe withdrawal rate is back in the 4.5-5% range with the layered approach. And the next time CNBC runs another "Are you retiring into a stagflation cycle?" panic segment, you will already know the answer for your own portfolio.
The Bottom Line: Sequence of Returns Risk Is Solvable
Most personal-finance articles end on a vague note. Let me be sharper.
Sequence of returns risk is the single biggest variable nobody plans for. It is also the single most solvable. The math doesn't require a CPA. The tools don't require an advisor. The discipline doesn't require heroic willpower — it requires systems.
The 2026 setup is genuinely dangerous: CAPE 40, 3.8% CPI, hawkish Fed risk, Morningstar at 3.9%, Shiller forecasting 1.3% returns. If you are inside the fragile decade and running on the assumption that the 4% rule will quietly carry you, you are taking a risk you do not have to take. The same data shows that retirees who stack the five layers — cash bucket, bond tent, guardrails, dividend layering, dynamic withdrawal — push their safe rate back up to 4.5-5.0% and lift FIRE-horizon success from 56% to 90%.
The difference between the Retiree A who ends with $3.2M and the Retiree B who runs out at age 87 isn't talent or luck. It is whether you took the order-of-returns problem seriously enough to build the defenses before you needed them.
The cash bucket goes up first because it is the fastest, cheapest insurance against the most common failure mode. Then the glide path. Then the guardrails. Then the dividends. Then the spending flex. Layer by layer, your portfolio stops being a hostage to the year you were born and starts being a system you actually control.
If you take one thing from this article, take this: average returns don't determine your retirement. Order of returns does. And order of returns is something you can defend against, starting this weekend, with the tools you already have.
Have questions about modeling your own sequence-of-returns shock, sizing the cash bucket, or building the glide path for your specific situation? Email me at dennis.vymer@myfinancialfreedomtracker.com.
For tracking the five layers month over month — cash bucket, allocation, guardrail trigger, dividend coverage, spending flex — use MFFT's net worth tracker. No signup required, and built for exactly this kind of multi-bucket retirement planning. And if you want the companion pieces, start with Monthly Dividend Income Strategy for the Layer 4 build, The Roth Conversion Ladder for tax-efficient guardrail-triggered withdrawals, and Die With Zero vs FIRE for the spending-smile other half of the dynamic withdrawal story.
The retirees who fail aren't the ones who didn't save enough. They're the ones who saved exactly enough — and retired into the wrong decade.
Make sure that's not you.
Stay Updated
Get notified when we publish new articles.
Ready to Apply This?
Start tracking your finances today and put these tips into practice.
- Import bank statements in seconds
- AI-powered categorization
- Beautiful visualizations
- Set and track financial goals
Related posts
 Master Your Money
The Cash-Sweep Trap: Why Your Brokerage Might Be Paying You 0.01% on Cash in 2026 (And How to Fix It)
I found dead money in my own accounts: a cash sweep account paying 0.01% sitting right next to a money fund paying hundreds of times more, and I never chose it. Here's the real dollar cost of idle cash in 2026, and the two-minute audit that fixes it.
 Master Your Money
Cash Stuffing, Tested: Does the Viral Envelope Method Actually Build Wealth in 2026?
Cash stuffing and the 100-envelope challenge are everywhere in 2026 — but do they build wealth? The psychology, the hidden cost of idle cash, and a smarter fix.
 Master Your Money
Sinking Funds: The System That Stops Surprise Bills (2026)
Sinking funds are the missing layer between your budget and emergency fund — pre-funded buckets for bills you see coming. Get the categories, math & 2026 setup.
 Master Your Money
The Sunday Money Reset: The 15-Minute Weekly Habit Beating Monthly Budgets in 2026
Weekend budgeting is winning in 2026: a 15-minute Sunday Money Reset that catches overspending weekly — the exact 6-step checklist and the science.
 Master Your Money
Quiet Saving: How to Build Wealth Without Telling Anyone (The 2026 Anti-Flex Trend)
Quiet saving is the 2026 anti-flex money trend: automate your savings, skip the loud posts, and build wealth privately. Here is the system and the math.