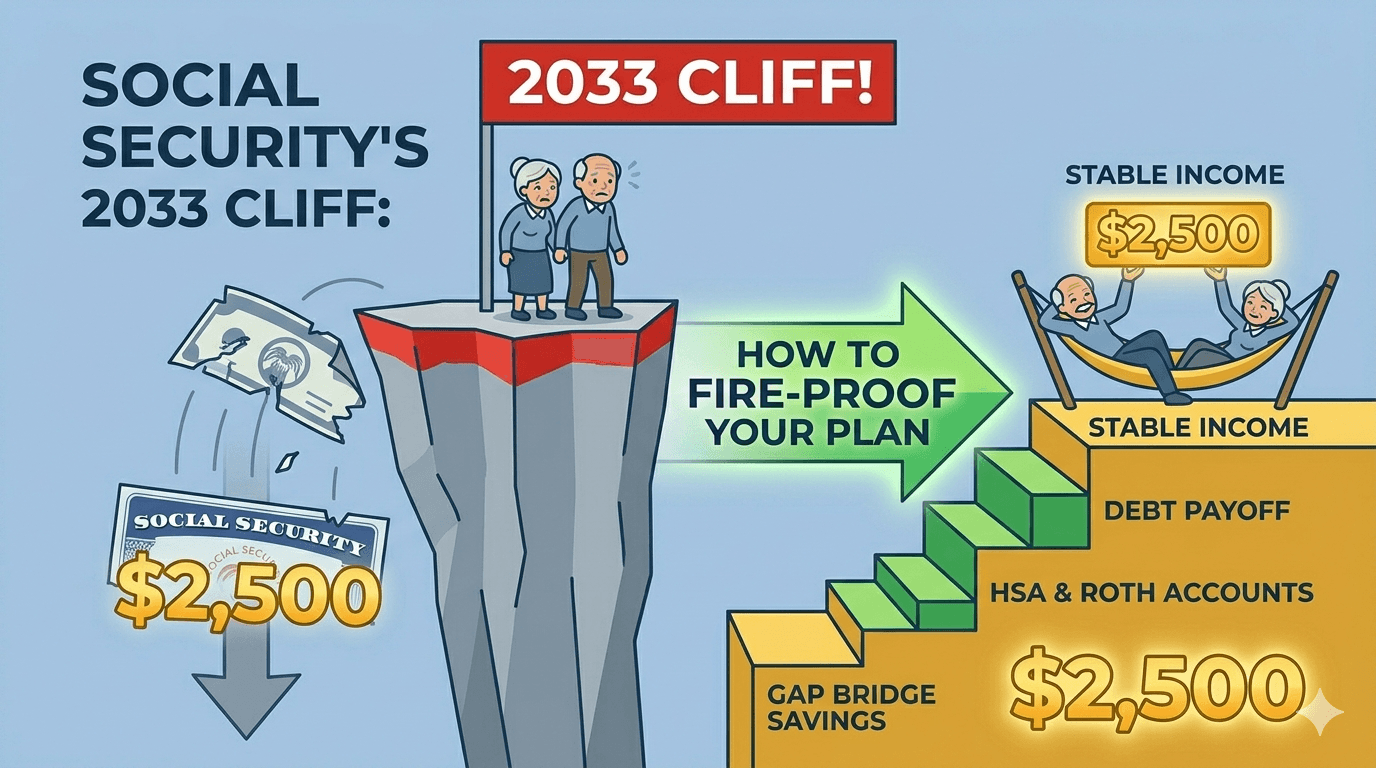
Social Security 2033: FIRE-Proof Your Plan for a 23% Cut
Picture two retirees standing at the same finish line, one year apart.
Marcus retires at the end of 2031. His first Social Security check lands at $2,500/month, exactly what the SSA statement said it would. He builds his budget around it.
Two years later, his deposit shows up as $1,925. Same name, same account — but a 23% automatic pay cut he never agreed to.
That is the Social Security 2033 cliff in one anecdote. The 2025 Trustees Report put OASI (Old-Age and Survivors Insurance) trust-fund depletion in 2033. The CBO's May 2026 baseline moved it forward to 2032, with an average 28% cut per year through 2036. The One Big Beautiful Bill Act, signed last summer, accelerated the timeline by ~$30B/year.
If you are pursuing FIRE (financial independence, retire early), this is your problem more than anyone's. The 4% rule was silently subsidized by Social Security for fifty years. Pull 23% of that subsidy out and the math underneath your FIRE number bends.
This is a do-the-math piece, not a panic piece. Here is what the social security 2033 benefit cuts actually mean for your plan, with a five-bucket playbook you can run this weekend.
The 2033 Cliff Is Real: What the May 2026 CBO Update Says
Let's start with the numbers, in plain English.
Social Security is not "going bankrupt." It is funded by ongoing payroll taxes (FICA) plus a giant savings account called the OASI Trust Fund. The payroll taxes keep flowing forever. The savings account is what is about to run dry.
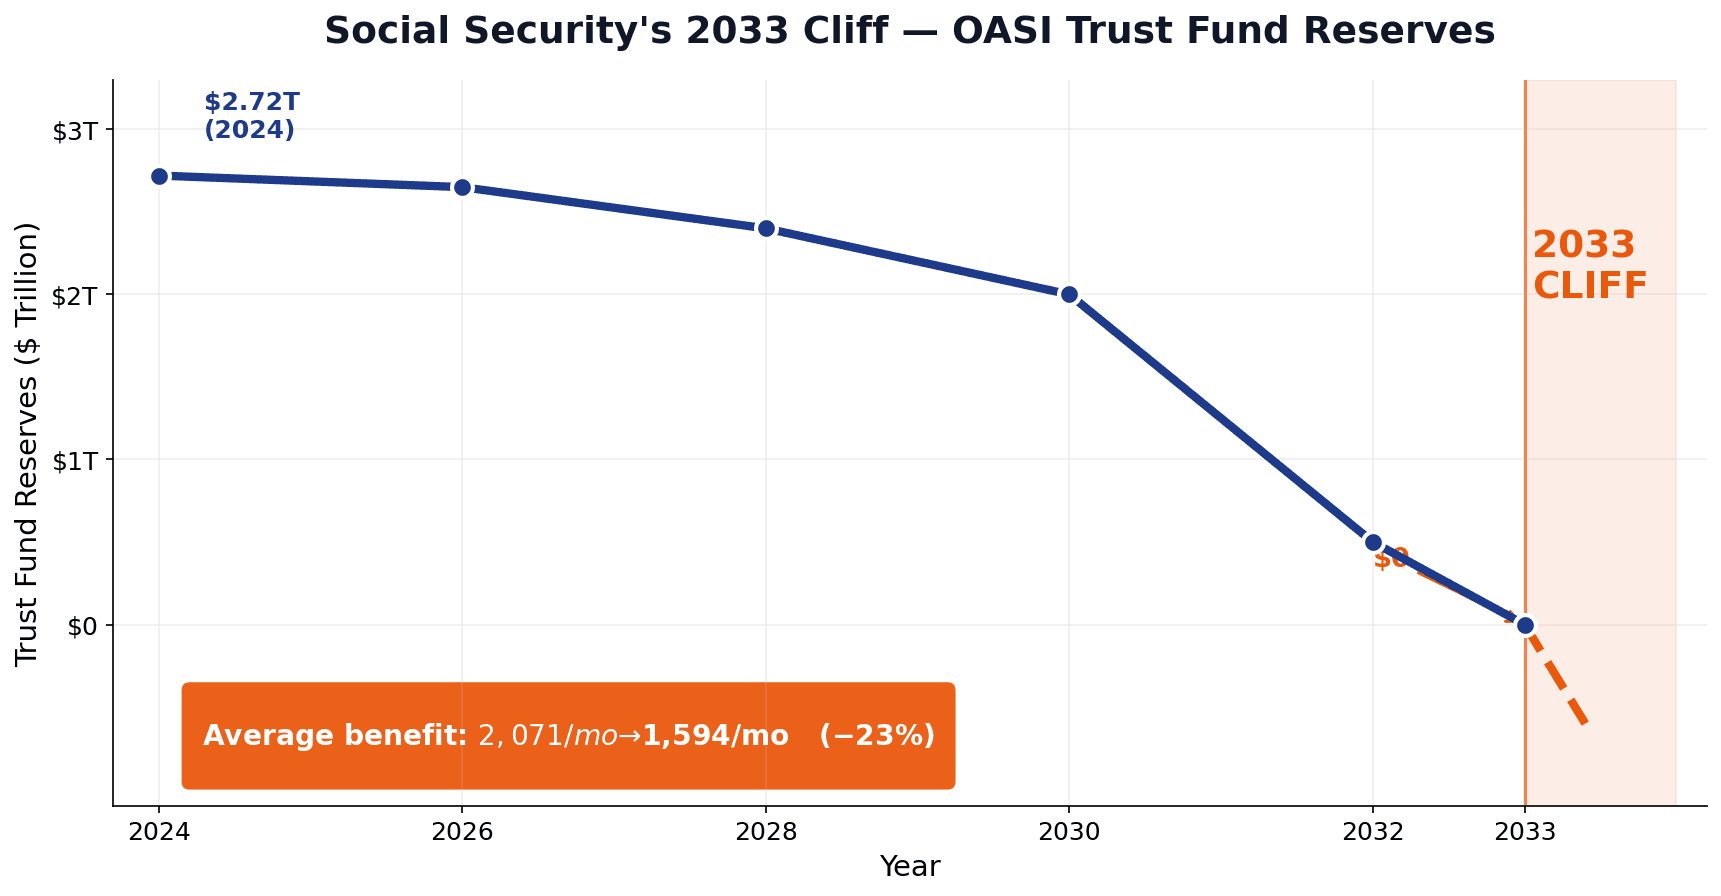
The 2025 Trustees Report projects OASI depletion in 2033. Once empty, the program pays only what payroll taxes bring in — about 77% of scheduled benefits. That is the automatic 23% cut, written into law since 1983.
The Congressional Budget Office's 2026 trust-fund baseline is more aggressive: 2032 depletion, a 7% partial cut that year, then an average 28% cut per year from 2033 through 2036. By the end of the 75-year window, the gap grows to 31%.
Three things shifted since last year:
- The One Big Beautiful Bill Act (July 2025) added a $6,000 senior deduction and reduced taxation of benefits. Good for current retirees, bad for the trust fund — about $30B/year of revenue gone.
- The worker-to-beneficiary ratio is now 2.7-to-1, down from 5.1-to-1 in 1960.
- Congress has not acted. Every prior fix (1977, 1983) came at the last minute. 2026 senators are talking, but no bill is on a desk.
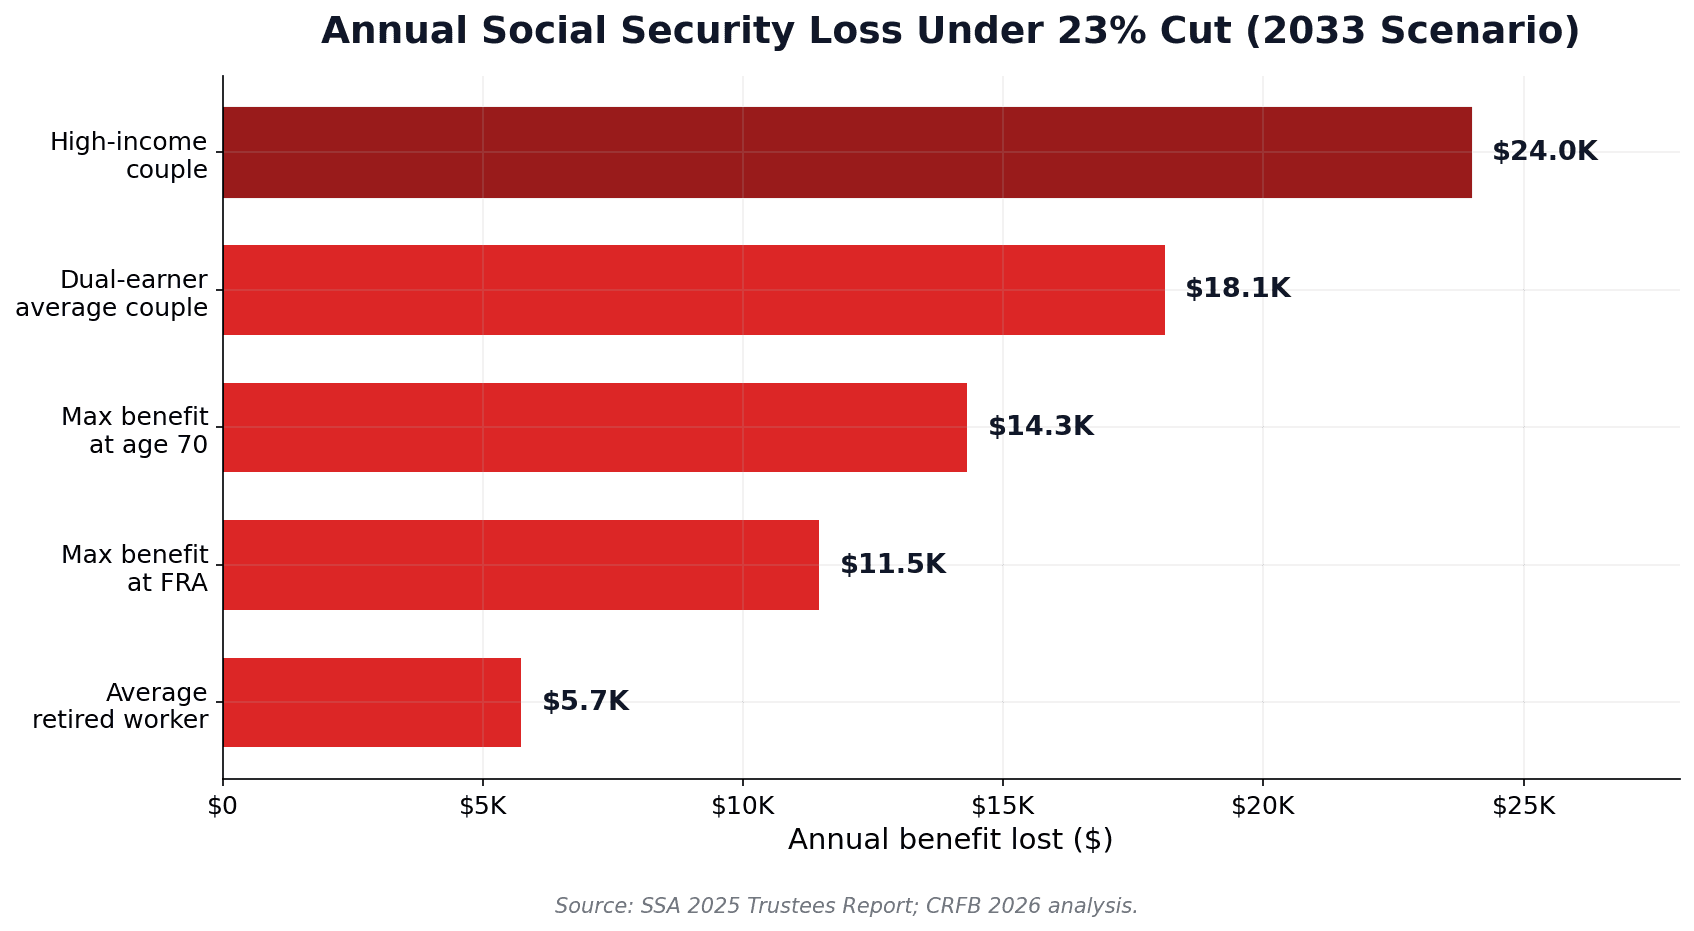
The dollar version makes it real. The average retired worker received $2,071/month in January 2026. A 23% cut drops that to $1,594/month — a $5,724/year hole. The Committee for a Responsible Federal Budget calculates a dual-earning average couple retiring in 2033 loses $18,100 per year. High-income couples lose closer to $24,000.
The Urban Institute estimates senior poverty would jump from ~10% today to nearly 40% if the cut hits unmitigated. The public-policy headline aside, the private-finance one is simpler: your retirement plan probably already counts on the full benefit, and you may not have noticed.
How Big a Hit Is It for You? Three Real Scenarios
Abstract percentages don't move people. Dollars do.
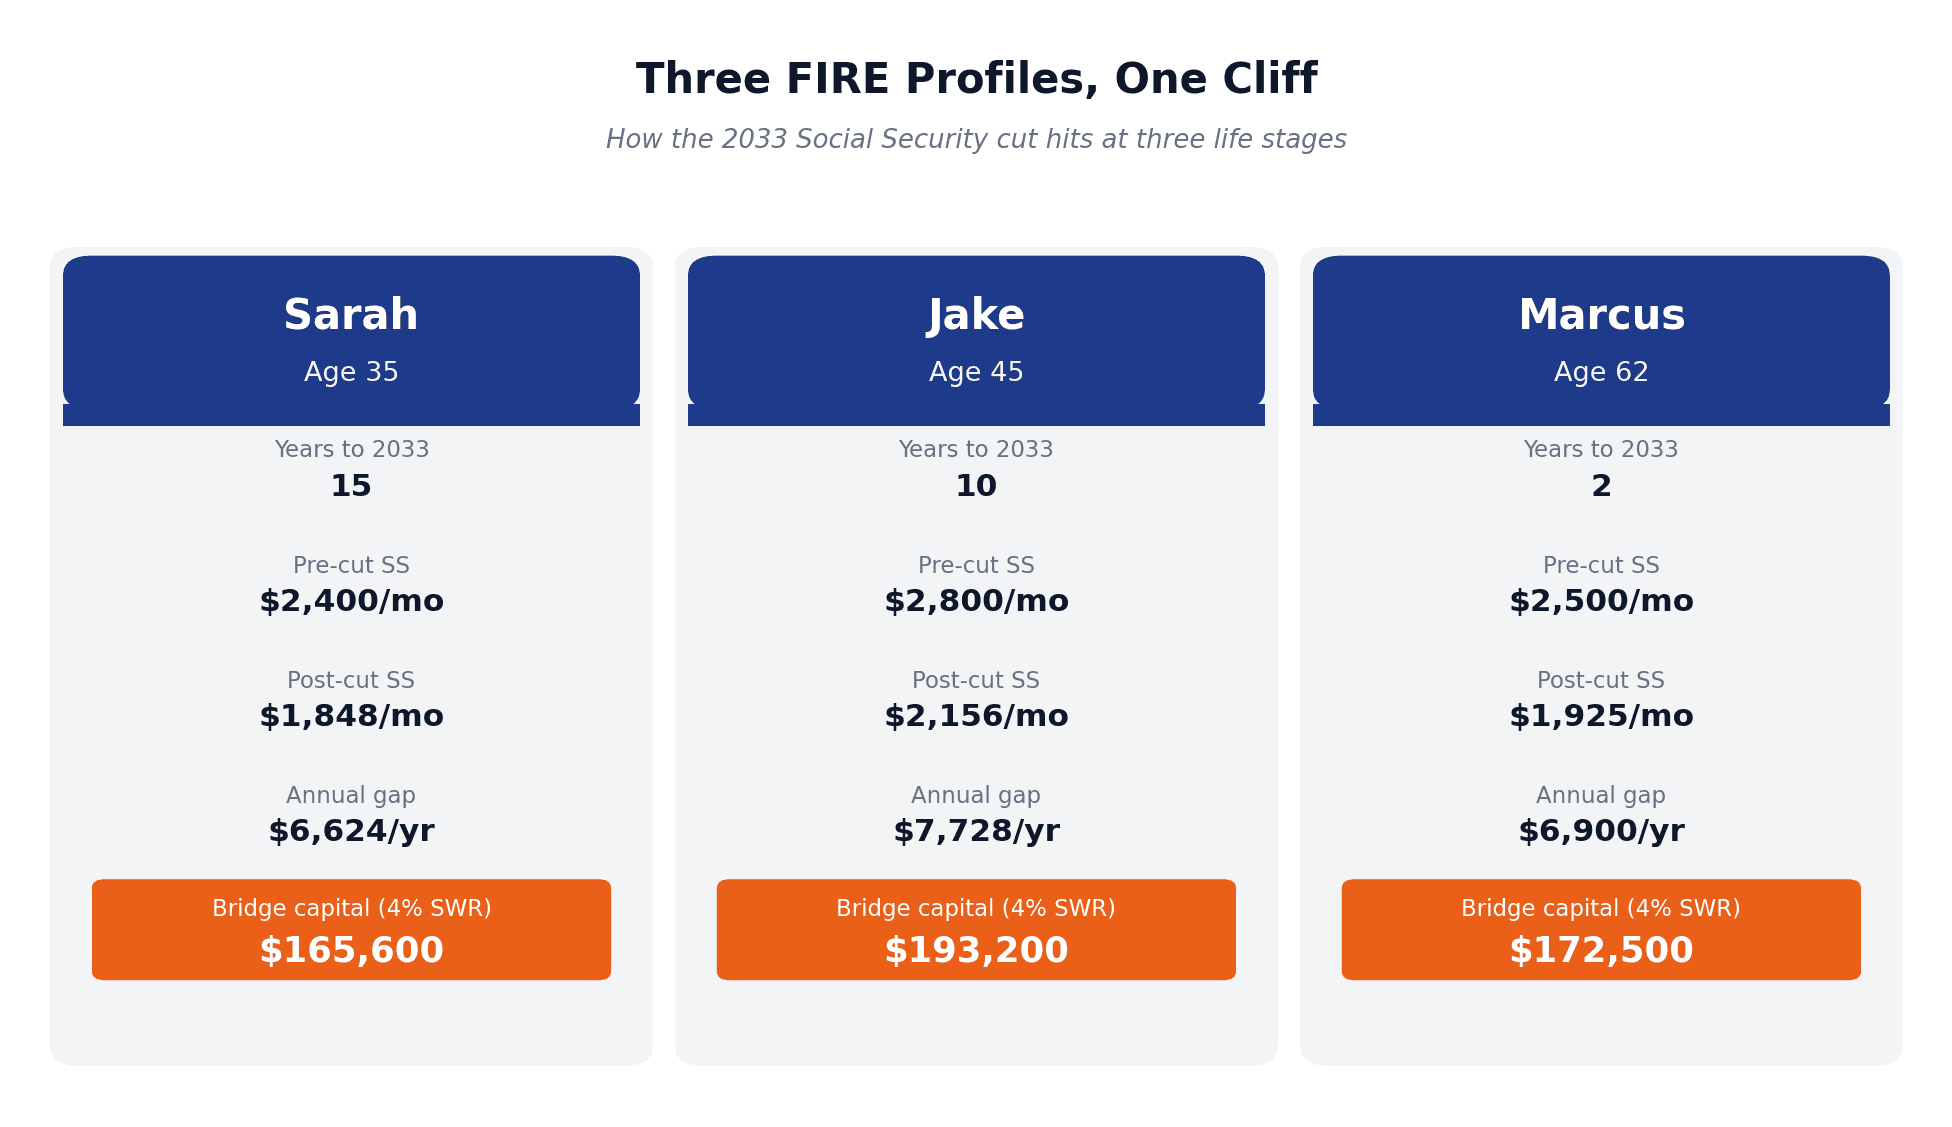
Sarah, 35, software engineer. Goal: retire at 50 with a $1.5M target. Projected SS at 67: $2,400/month. Post-cut: $1,848. Annual gap: $6,624.
Jake, 45, marketing director. Coast-FIRE flavor. Plans to retire at 55 with $1.2M and claim at 67. Projected benefit: $2,800/month. Post-cut: $2,156. Annual gap: $7,728.
Marcus, 62, current high-earner. Plans to claim at full retirement age in 2031. Projected: $2,500/month. Post-cut starting 2033: $1,925. Annual gap: $6,900 — landing two years into retirement, the worst possible timing.
Marcus is the high-risk cohort with zero accumulation years left. Jake has 10. Sarah has 15. All three are fixable — the playbook just looks different at each age.
The rule of thumb I use:
Each $1,000/year of expected Social Security that disappears = roughly $25,000 of additional capital needed at a 4% safe withdrawal rate, or $28,500 at 3.5%.
Sarah's $6,624 gap = $165,600 of bridge capital. Jake's $7,728 = $193,200. Marcus needs $172,500 of cash-equivalent buffer, which is a very different problem at 62 than it is at 35.
If you have not yet pinned a FIRE number to your name, the What is Coast FIRE framework is a useful place to anchor. The bridge math is then just an overlay.
Why FIRE Investors Should Care About the Social Security 2033 Cliff More Than Anyone
Here is the uncomfortable truth most FIRE bloggers gloss over.
The 4% rule — Bengen's original safe withdrawal rate (SWR) — was built on historical returns of a 50/50 stock/bond portfolio over 30-year retirements. It does not include Social Security explicitly. But almost every real FIRE plan does.
ChooseFI's case-study math is blunt: $10,000/year of Social Security reduces your required FIRE nest egg by about $250,000. $20,000/year reduces it by about $500,000. The benefit was always there in the background, quietly making your FIRE number smaller.
Remove 23% of that subsidy and your number grows. Jake planned for $52,800/year of household SS between him and his wife. Post-cut: $40,656 — $12,144/year of disappearing income. At 4% SWR, that's $300,000 of extra capital needed. His $1.5M FIRE number becomes more like $1.8M.
Coast FIRE and barista FIRE math change too. Coast assumes your existing invested base compounds, untouched, to cover retirement at a target age. If the SS subsidy shrinks, your "coast" point either gets pushed later or your target balance gets larger. Karsten Jeske ("Big ERN") argues SWRs for early retirees with uncertain Social Security often need to run 3.25–3.5%, not 4%.
The takeaway: if your spreadsheet plugs in 100% of your SSA-statement benefit, you are running an optimistic scenario. Build a second scenario at 77% and treat that as your base case.
Bucket 1: Recalculate Your FIRE Number With the Cut Baked In
Do this first, before any new savings move.
Pull two numbers from ssa.gov/myaccount: your projected benefit at age 67, and your spouse's. Build two columns side by side.
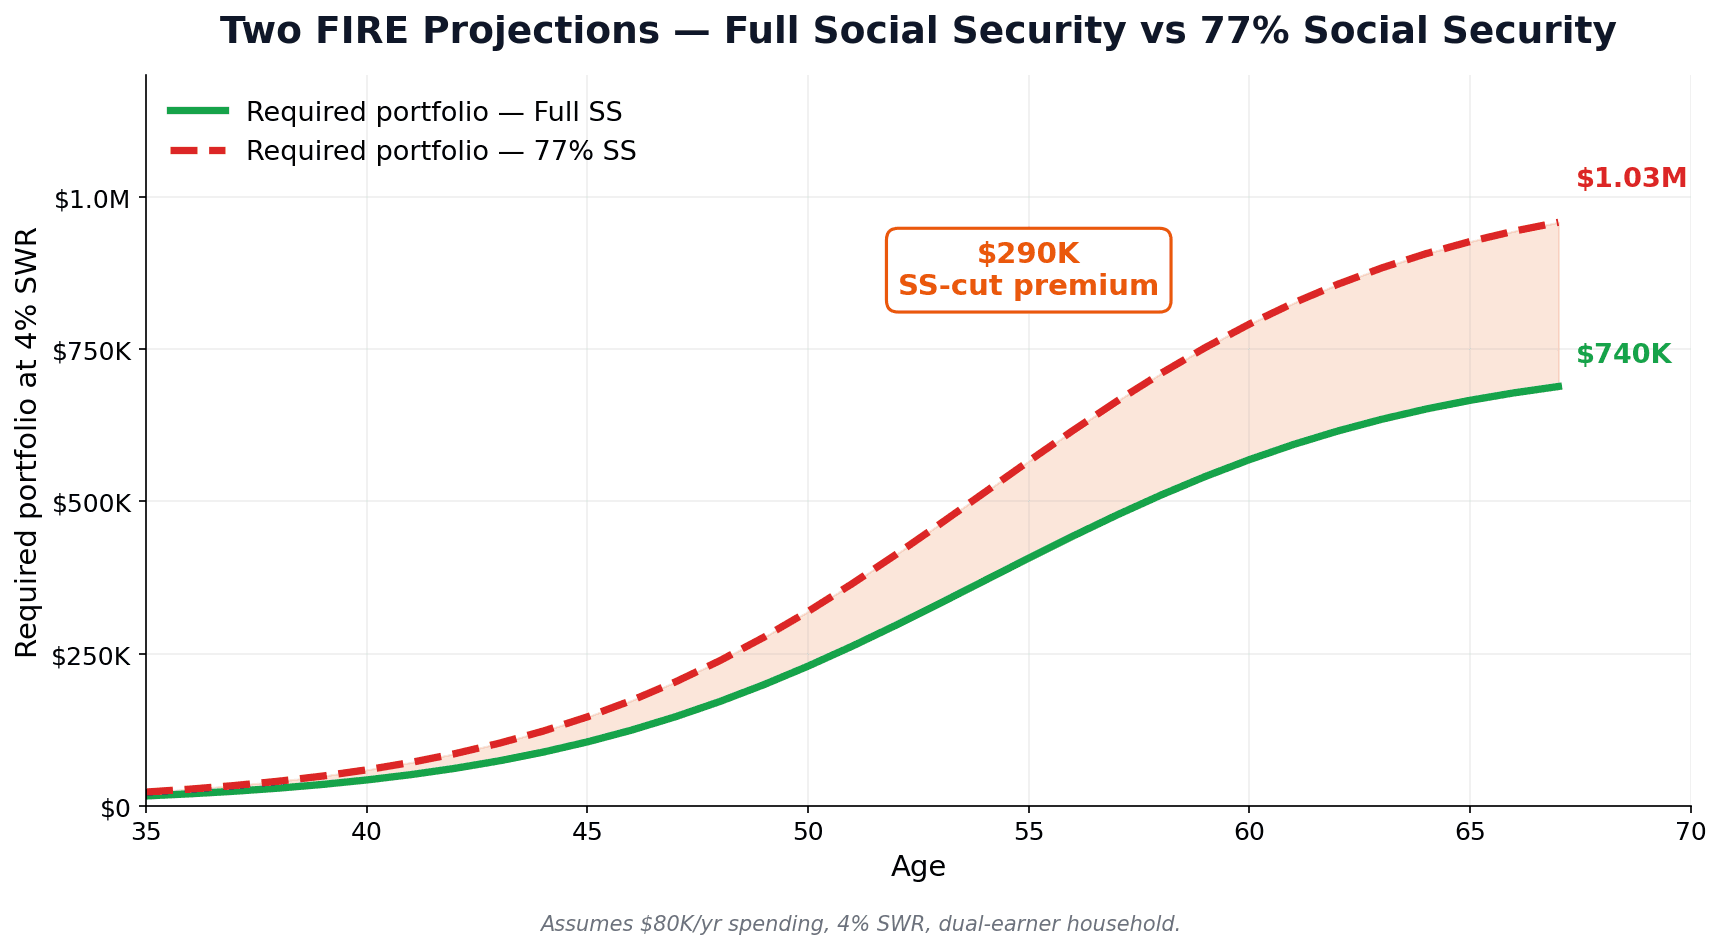
| Component | Full SS scenario | 77% SS scenario |
|---|---|---|
| Monthly SS (you) | $2,400 | $1,848 |
| Monthly SS (spouse) | $1,800 | $1,386 |
| Annual SS combined | $50,400 | $38,808 |
| Spending in retirement | $80,000 | $80,000 |
| Withdrawal needed | $29,600 | $41,192 |
| Required portfolio at 4% SWR | $740,000 | $1,029,800 |
The cut adds roughly $290,000 to the FIRE target at 4% SWR — call it 30%. Higher-spending households see a bigger bump; lower-spending households see less.
This is where one dashboard pays off. Inside MFFT I keep two parallel FIRE projection scenarios — "Scheduled SS" and "77% SS" — and the chart shows the spread in real time. The gap is your insurance premium.
Run this for yourself. Write the delta on a sticky note — that's your bridge target.
Bucket 2: Build a Social Security Gap Bridge
The good news: the gap is almost always smaller than it looks, especially under age 45. Kiplinger's model gives a stark age curve for self-insuring against the full 23% cut with extra savings alone:
| Current age | Extra monthly savings needed |
|---|---|
| 25 | $35 |
| 35 | $80 |
| 45 | $215 |
| 55 | $701 |
| 60+ | $1,400+ |
That curve is just compounding doing its job. A 25-year-old has 38 years of growth on every dollar; a 55-year-old has 12. Run the math the other way: $4,500/year extra (about $375/month) at a 7% real return for 20 years grows to $197,000 — enough to cover a 25% SS cut for 25 years at a 4% SWR. For most readers under 50, an extra 1–2 percentage points of savings rate redirected into a dedicated "SS Gap Bridge" brokerage bucket fully closes the gap.
A few notes on the bridge bucket:
- Keep it taxable for flexibility in your 60s and 70s when the cut bites.
- Index funds, not stock picks. A broad-market or target-date fund is the right tool.
- Tag it in your tracker. Tagged money gets funded; untagged money gets spent.
- Automate the deposit the day after payday. Friction is the enemy.
Bucket 3: The Claiming-Age Calculus Just Changed
Pre-cliff, the standard advice was simple: wait until 70. Delay credits boost your benefit by 8%/year past full retirement age (FRA), and the breakeven (vs. claiming at 62) sits around age 80 for most people. If you expect to live past 80, you wait until 70.
Post-cliff, the math gets more nuanced. The benefit you delay growing is the same benefit that gets cut 23% in 2033.
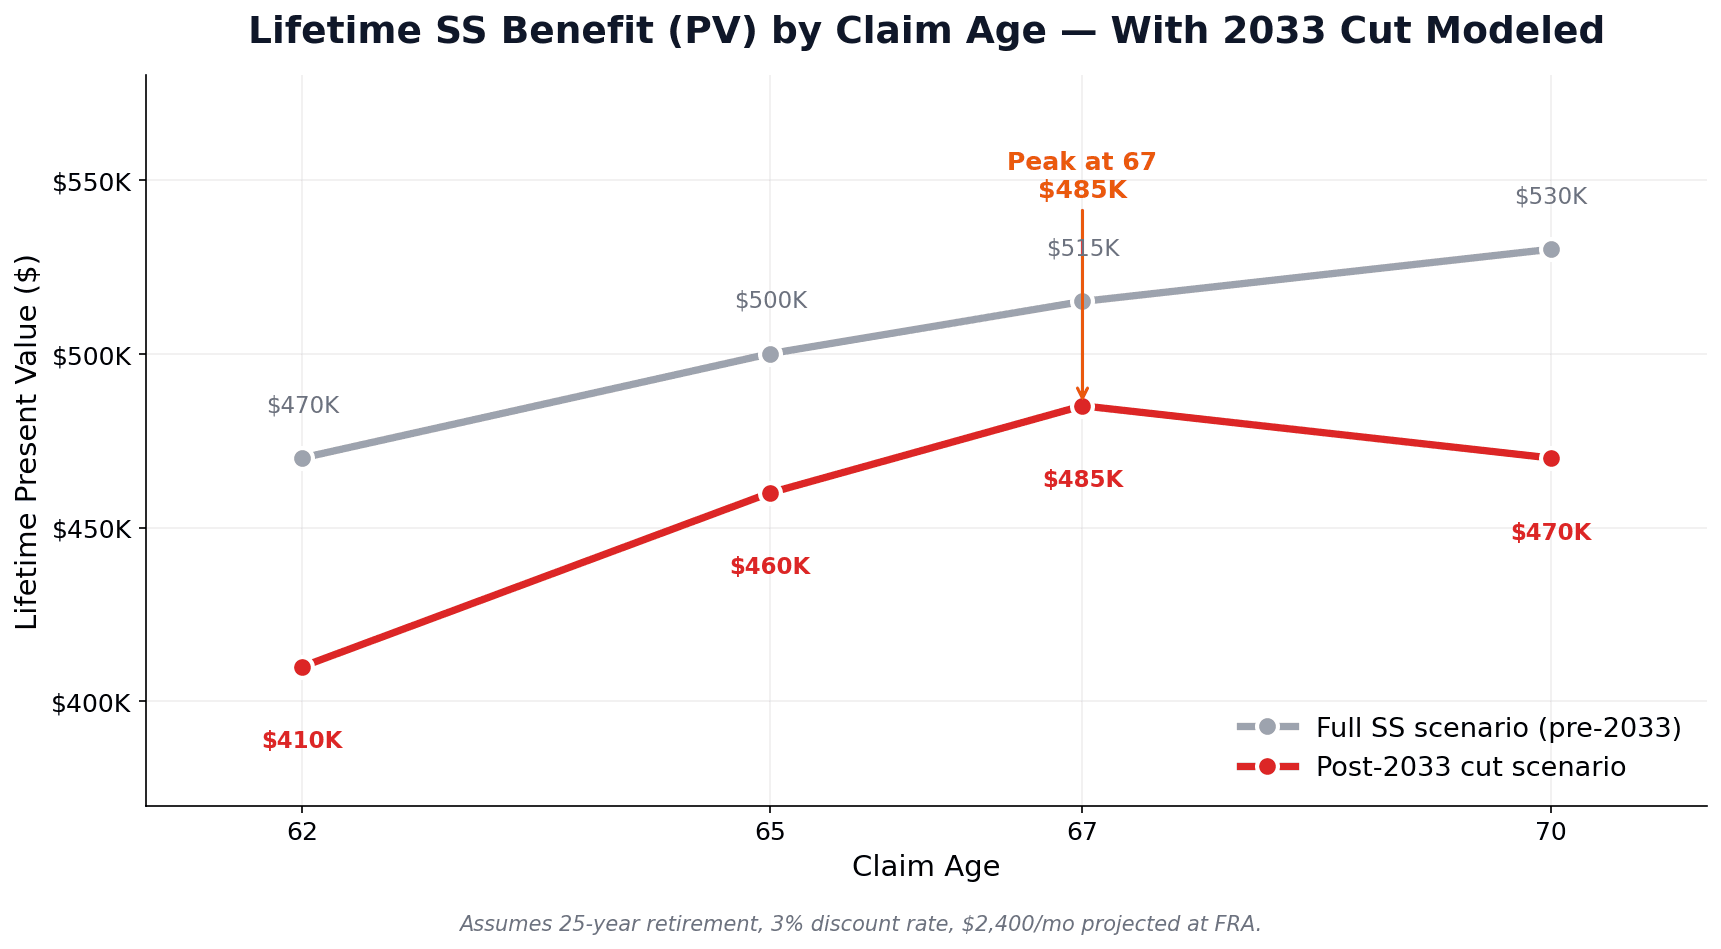
Take a 62-year-old in 2026 with a $2,400 projected benefit at FRA (67):
- Claim at 62 (70% of FRA): $1,680/month, no cut until 2033, then -23% = $1,294. Lifetime PV over 25 years at 3% discount: ~$410,000.
- Claim at 67 (100%): $2,400/month from 2031, -23% in 2033 = $1,848. Lifetime PV: ~$485,000.
- Claim at 70 (124%): $2,976/month from 2034 (already in cut era), so the entire benefit is paid at 77% of scheduled = $2,291. Lifetime PV: ~$470,000.
In this example, claiming at 67 actually beats claiming at 70 because the 70 claim never gets to experience the full pre-cut benefit. Pre-cliff, age 70 won. Post-cliff, FRA wins by a hair.
Rules of thumb that survive the cut:
- Longevity in your family (parents past 85)? Wait. Even at 77%, the delayed benefit is the cheapest longevity insurance available.
- Healthy with other income? FRA is now the math-defensible middle path.
- Age 62 is still mostly a math trap unless you have health concerns or no other savings.
Claiming age is genuinely personal — but defaulting to "always claim at 70" without modeling the cut is using a pre-2025 framework.
Bucket 4: Stack the Tax-Advantaged Accounts That Do Not Depend on Washington
Every dollar of Social Security is paid at Washington's discretion. Every dollar in your HSA, Roth IRA, and Roth 401(k) is paid at your discretion. The cliff makes that distinction enormous. The post-cliff priority order I run:
1. HSA first. The Health Savings Account has the only triple-tax advantage in the tax code: pre-tax contributions, tax-free growth, tax-free withdrawals for qualifying medical expenses. 2026 limits are $4,400 (self-only) and $8,750 (family), with a $1,000 catch-up at 55+. Used as a stealth retirement account, the HSA is the single most tax-efficient retirement dollar you can own. The HSA stealth retirement account deep-dive covers the mechanics.
2. Roth IRA + Roth 401(k). 2026 IRA limit: $7,500 ($1,100 catch-up). 401(k) deferral: $24,500, with $8,000 catch-up at 50+ and an $11,250 "super catch-up" at ages 60–63. Roth dollars compound tax-free and come out tax-free — and in most current means-test formulas, Roth withdrawals don't count as income. If Congress eventually means-tests Social Security, Roth income may be partly invisible to that test.
3. Roth catch-up mandate (new for 2026). Workers 50+ earning over $150,000 in prior-year FICA wages must now make catch-up contributions on a Roth basis — covered in the 2026 retirement contribution rules and Roth catch-up breakdown. For high-earning FIRE chasers, it's forced tax diversification you would have wanted anyway.
4. Traditional 401(k) up to match. Always grab the employer match. Beyond that, current vs. future marginal rate dictates the call.
5. Taxable brokerage. The flexible bucket. Pair it with the SS Gap Bridge.
Notice what is missing from this list: anything that depends on a future Congress. That's the point.
Bucket 5: Build a Withdrawal Order That Survives a Benefit Cut
The cliff is also a tax event. The transition year — when your $2,400 check becomes $1,848 — is when you'll most need a flexible withdrawal sequence.
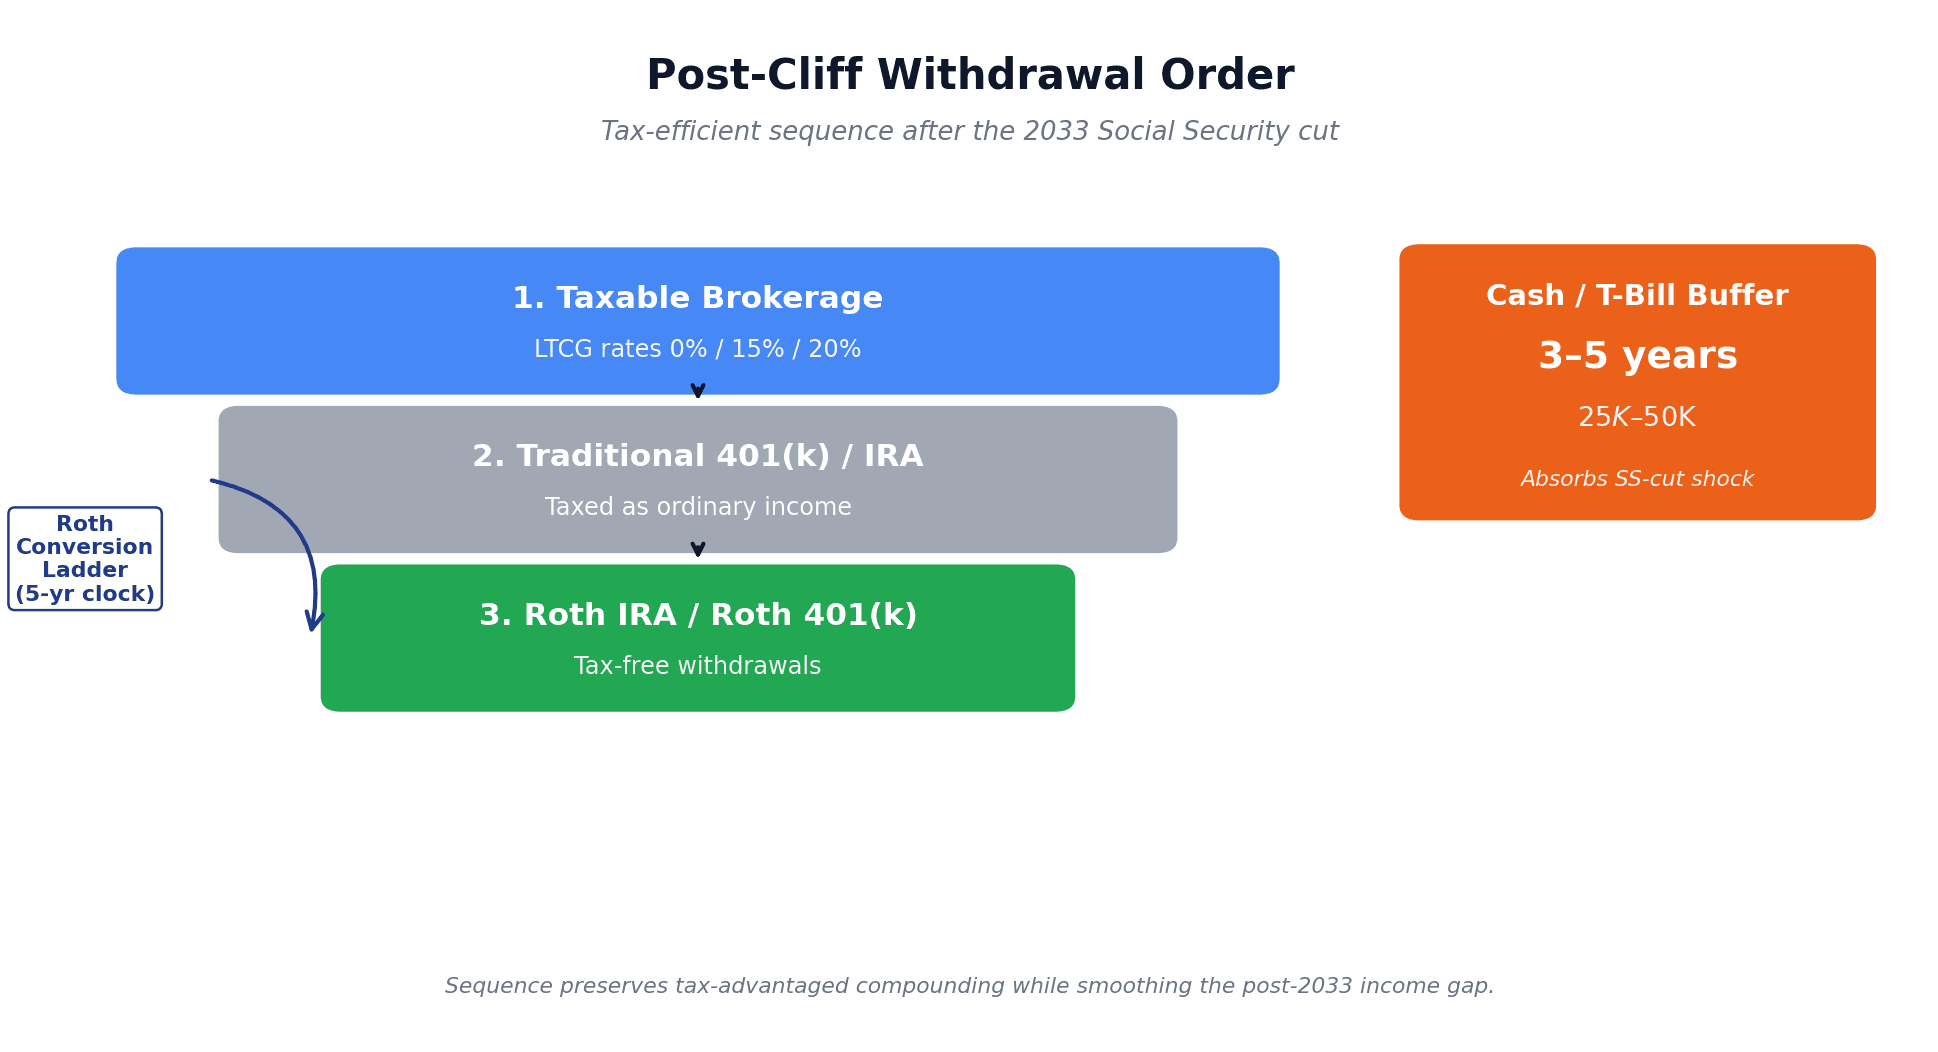
The SS-cut-survivable withdrawal order:
- Taxable brokerage first. Realized gains are taxed at long-term capital gains rates (0%, 15%, or 20%) — almost always lower than ordinary income. Drawing taxable first also lets your tax-advantaged accounts compound longer.
- Traditional 401(k) / IRA second. Ordinary income tax on every dollar. Run conversions during low-income years to manage this.
- Roth IRA / Roth 401(k) last. The most flexible, lowest-tax bucket. Save it for years when you most need to manage your AGI (e.g., to stay under an IRMAA cliff or a means-test threshold).
For pre-59½ retirees, the Roth conversion ladder for early retirement is the standard bridge. Convert Traditional → Roth during low-income years before SS starts, pay tax at low brackets, withdraw the converted principal tax-and-penalty-free five years later. Used well, the ladder shaves six figures off lifetime taxes and gives you a flexible withdrawal layer to absorb shocks like a sudden SS cut.
Pair that with a 3–5 year cash and T-bill buffer when you start drawing SS. A $25K–$50K bond ladder means you don't have to sell equities into a bad market to plug a sudden $6,900 hole. It also hedges sequence-of-returns risk — double duty.
What If Congress Actually Fixes It?
Every fix in Social Security's history came at the last minute. Penn Wharton's Budget Model published six reform options in March 2026 — the three most politically plausible:
Scenario A — Raise the taxable wage base. FICA stops at $184,500 today. Lifting the cap to ~$400K closes 60–80% of the 75-year shortfall (Brookings, CRFB, and Penn Wharton's Budget Model broadly agree). Cost: high earners pay more. For most readers: no benefit cut.
Scenario B — Push FRA to 69. The House Republican Study Committee proposes phasing FRA from 67 to 69 over 8 years. Effective cut: ~13% for future beneficiaries. The cliff softens but doesn't vanish.
Scenario C — Means-test high earners. Households above $100K–$400K in retirement income see graduated reductions. Ironically, FIRE-ers building large nest eggs may end up the target — one more argument for Roth.
Don't plan around a fix. Plan around the cut and adjust if a fix arrives. The math is asymmetric: self-insure and a fix means extra money. Assume a fix and Congress doesn't act, and you have a $6,000–$18,000 annual hole you can't close at 70.
Your 30-Day Action Plan: From Anxiety to Algorithm
Long enough on theory. The 30-day checklist:
Week 1 — Pull your SSA statement. Log into ssa.gov/myaccount. Note your projected benefit at 62, FRA, and 70. Sticky note: full benefit and 77% of full benefit. That is your scenario range.
Week 2 — Re-run your FIRE number under both scenarios. Plug 100% SS and 77% SS into whatever tracker you use. Note the delta on the same sticky note.
Week 3 — Open or fund the SS Gap Bridge. Use Bucket 2's math. Open (or label) a taxable brokerage account "SS Gap Bridge." Set the auto-transfer. Even $80–$215/month at age 35–45 closes the gap over a decade.
Week 4 — Recheck claiming age, withdrawal order, and rebalance. Revisit claim-age (Bucket 3), withdrawal order (Bucket 5), and Roth-vs-Traditional split (Bucket 4). Schedule quarterly reviews so the plan stays alive.
If you take one thing from this article: the cliff is a known unknown. The dollar impact is calculable. The fix-it cost (for most readers under 50) is one fancy dinner per month, redirected. Manageable — but only if you do it on purpose.
Reframing helps. Social Security was always a backstop, not a paycheck. The time freedom over retirement lens is the right one to hold this in — your goal was never "retire at 65 on a federal check." It was time freedom built on a portfolio you control. The 23% cut is one more reason to lean toward the version of FIRE that doesn't depend on a single government program.
Bottom Line: The 2033 Social Security Cut Is Now Part of the Plan
The social security 2033 benefit cuts are no longer a future-tense problem. They are baseline assumptions, the way a 4% SWR is a baseline assumption.
Three things to internalize:
- The cliff is real, but partial. Social Security is not disappearing — it's going to 77%, unless Congress acts. Plan for the 77% and treat any fix as upside.
- The math is calculable. Each $1,000/year of lost SS = ~$25,000 of bridge capital at 4% SWR. Most under-50 readers can close the gap with an extra 1–2% of savings rate.
- The five buckets compound. Recalculate your FIRE number. Fund a gap bridge. Re-think claiming age. Stack accounts Washington can't touch. Order withdrawals to survive a benefit cut.
For most readers, the cliff doesn't change the destination — it changes the route. You still get to time freedom, just with a slightly bigger nest egg, claiming at a slightly earlier age, with a few more tax-free dollars behind you.
That is the whole post in one sentence: don't panic, do the math, and let the algorithm replace the anxiety.
If you want one place to model both scenarios side-by-side and track your SS Gap Bridge alongside the rest of your goals, that's what My Financial Freedom Tracker is built for. Run the numbers this weekend, then go enjoy your Sunday. The cliff has a date on the calendar — your plan should, too.
Stay Updated
Get notified when we publish new articles.
Ready to Apply This?
Start tracking your finances today and put these tips into practice.
- Import bank statements in seconds
- AI-powered categorization
- Beautiful visualizations
- Set and track financial goals
Related posts
 Start Here
Empower vs Monarch Money (2026): Fees, Features, Verdict
Empower is free but sells 0.89%/yr advice once you link $100K. Monarch costs $99.99/yr and budgets better. June 2026 verified pricing, honest verdict.
 Start Here
Net Worth Trackers That Don't Link to Your Bank (2026)
Track net worth without handing over bank logins: spreadsheets, GnuCash, Wealthfolio, Worthy, Kubera, and my manual-first tracker — honestly compared.
 Start Here
YNAB Alternatives That Are Actually Free (2026 Guide)
YNAB costs $109/year in 2026. EveryDollar, Goodbudget, Actual Budget, spreadsheets, and my own tracker — what's actually free, with every catch listed.
 Start Here
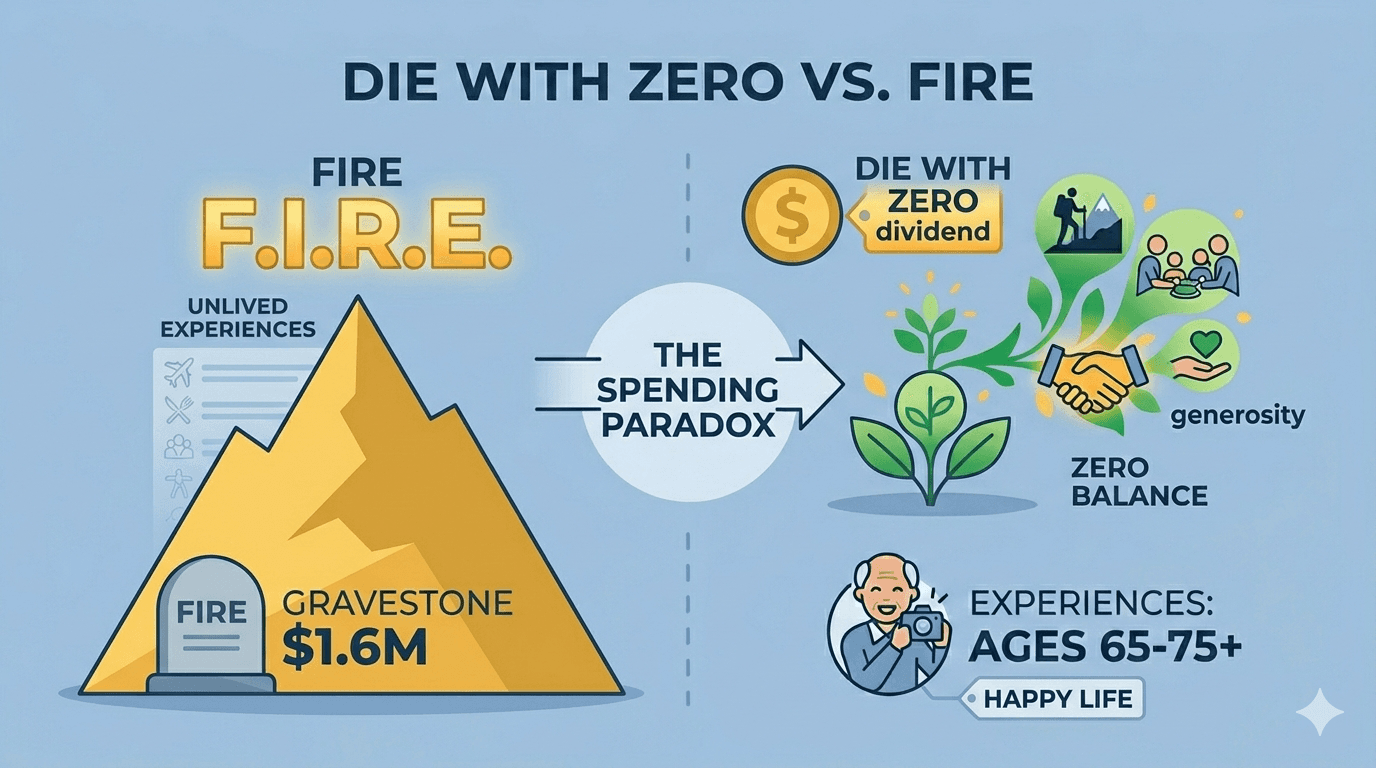
Die With Zero vs FIRE: The Retirement Spending Paradox
Most retirees withdraw just 2.1% of their portfolios while their best years pass. Memory dividends, the spending smile, and a hybrid framework that fixes it.
 Start Here
Barista FIRE vs Coast FIRE: Two Paths to Time Freedom
Barista FIRE vs Coast FIRE: both can cut your FI target 40-60% below 25x expenses. The math, trade-offs, and why 1 in 5 retirees go back to work anyway.